
AGBM102:
Lesson 1: Overview of the Food System
Overview
The food system is vital to everyone since nothing is more basic to life than food!
The number of people involved in providing food to consumers in the United States is enormous. One recent study estimates that at least 20 million workers are involved in producing, processing and distributing food. This means that roughly one in every six workers in the United States is employed in the food system. Only healthcare comes close to employing as many people.
The food system delivers over 1.8 trillion dollars of goods and services to US consumers each year. Around 10 cents of every dollar spent by consumers on all goods and services is spent on food. This includes food purchased in food stores, such as supermarkets, and in food service establishments, such as restaurants.
We often take it for granted that food will be available when we want to purchase it, where we expect to purchase it, and in the form that we want. But meeting our food needs is complex and involves a high degree of coordination throughout the system. This course focuses on how that coordination is achieved.
The key factor that makes the food system work is the existence and operation of markets. We focus on how markets work to ensure that we will actually have the food we want, when and where we want it.
Objectives
After completing this lesson, you will be able to:
- Identify the agents (economic actors) in the food marketing system
- Establish the stages of marketing
- Identify the functions performed by food markets
- Describe the essential components of the food system
- Understand how a dollar spent by consumers is distributed to participants in the system
- Describe what determines the location of production
Lesson Readings & Activities
By the end of this lesson, make sure you have completed the readings and activities found in the Lesson 1 Course Schedule.
Introduction to the Food System: The Story of Bread
Here with a Loaf of Bread beneath the Bough,
A Flask of Wine, a Book of Verse--and Thou
Beside me singing in the Wilderness--
And Wilderness is Paradise now.”
Omar Khayyam
Persian Philosopher, Astronomer, Mathematician, and Poet
1048-1131
Bread is a staple food in many societies. It is one of humanity’s oldest foods. The cultivation of grain to produce bread marked the beginning of agriculture in the Middle East around 12,000 years ago. So a good place to start this course is to focus on bread to explore how the food system works and what functions it performs. From a personal point of view, how it is that we can go to our local food store or supermarket and be pretty confident that we will find bread and lots of other food products on the shelves. This is something that we take for granted in the United States and other rich countries – but is not always the case in some poorer countries.
As the quotation above from a poem by Omar Khayyam illustrates, bread has been a highly significant product in the history of many cultures. There are over 800 references to bread in the Bible and over 400 in the Koran. When crop failure caused famine in France in the late 18th century, there is a story that the French queen was told that the peasants had no bread. She was recorded as saying “Let them eat cake”. She may not actually have said those words, but the disregard of the nobility for the condition of the French people at the time and the inability of the average person to obtain food, almost certainly contributed to the French Revolution of 1789. Bread is a product that has played a major role in history.
Although there are many varieties of bread, the basic process of making it is much the same. Some type of grain is ground (crushed) to make flour. The flour is made into dough by adding water. This is then baked to create bread. The texture of bread is often made lighter through the addition of a leavening agent (a gas-producing substance) such as yeast when making the dough. Wheat flour is most commonly used for making bread, but flours from rye, barley, corn (maize) and a range of other grains can be used. Each type of grain provides the protein and starch needed to make bread.
The Economic Agents of Bread
There are many individuals involved in making bread. We shall call these economic agents. Agents’ decisions on buying and selling the materials and services (e.g., transportation) that are needed to produce bread contribute to making sure that loaves appear on supermarket shelves every day. We can divide the economic agents involved in bread making into several categories. These categories will be addressed in the interactive simulation below.

check your answers
to see if they're
too high/low

the final answer for all agents


Marketing Channels – Food at Home and Food Away from Home
The bread example shows that many economic agents are involved in the food system. The system provides food that we can purchase and take home in order to prepare meals (food at home). That part of the system involves supermarkets and other types of food stores. The system also provides meals that are ready to consume (food away from home). That part of the system involves various types of restaurants and other vendors of ready-to-eat food.
Many of the agents involved in each of these two components of the food system (these can also be called chains) in the food system are the same, but there are some differences.
| Food at home | Food away from home | Function |
|---|---|---|
| Farmer | Farmer | Producer of raw materials |
| Assembler | Assembler | Moves materials to processor |
| Processor | Processor | Processes materials |
| Wholesaler | Distributor | Supplies stores/restaurants |
| Retailer | Food service | Interfaces with consumers |
We shall take an in-depth look at both of these marketing channels in this course.
Each of the functional steps above requires an exchange of materials or products between economic agents through some type of market transaction (buying and selling). Markets provide a mechanism for bringing buyers and sellers together and in doing so they create utility. In other words, they contribute to the creation of something useful for satisfying the needs or wants of consumers. There are three major types of utility that are created through the marketing process:
Time utility
Consumers want to have access to food products when they need them. If they are hungry they expect to be able to obtain food from the supermarket to prepare a meal at home, or to find a food service operation that will be serve them a ready-to-eat meal. Consumers want a reliable supply of food – in other words they want to be able to purchase food when they need it. Making sure that food products are available consistently when consumers want them is a major function of marketing.
Form utility
Consumers want to have access to food products that are in the form that they desire. If I want to purchase bread I don’t expect to go to the supermarket, find that there is no bread to purchase, but be offered flour and other ingredients with instructions on how to turn these into bread. Making products available in the form that consumers want is a major function of marketing.
Place utility
Consumers want to have access to food products in locations that are convenient for them. If I go to a supermarket in New York City to purchase bread I don’t expect to receive an apology from the manager that they have no bread in the store today, but if I would like to go to the store in Philadelphia (95 miles or over 150 kilometers away) they are sure to have some.
Essential Functions of Markets in the Food System
We often take it for granted that food products will be available to us when we want them, in a form that we want them, and where we want them. But these useful (some would say essential) characteristics of the food supply do not occur by magic – they are a product of the way that markets function in the food system. So what exactly are the functions that markets perform that enable everything to come together to create time, form and place utility for consumers?
Exchange functions: Markets bring buyers and sellers together so that they are able to exchange products. A market must exist through which the grain farmer can sell her/his grain to elevator companies. There must be a market through which elevator companies can sell grain to flour millers and so on. The exchange function sets prices for the ingredients that go into bread and sets the price of the loaf on the supermarket shelf. A major focus of this course is how prices are formed in the food system, in other words, how this exchange function actually works.
Physical functions: Markets perform a series of functions that are essential for ensuring that consumers are able to purchase the products that they want. The most important functions are storage (lessons 12 and 13), transportation (lessons 11 and 12) and processing (lesson 6). We examine how these functions are performed by the food system and the economic forces that drive them.
Enabling functions: There are functions that markets provide that are essential to the smooth functioning of the food system, but which are less obvious than the exchange and physical functions described above. These functions are:
- Standardization – Knowing what you are purchasing and having confidence in those purchases is a major issue for food. Standardization to ensure product quality is a major feature of markets in the food system. We examine this in lesson 10.
- Financing – There is a saying “money makes the world go round”. Finance is necessary for the food system to function. Farmers must be able to have access to credit to produce their wheat since they will receive payment for the crop several months after planting. Credit is important to other participants in the food system to enable them to finance their day-to-day operations and to help fund investments (in flour milling or baking equipment, for example). In this course we look at some important aspects of financing in the food system, for example, in determining storage decisions (lesson 13).
- Market intelligence – Markets provide information to buyers and sellers in the food system. Trends in prices are a major source of information on which the farmer can base decisions on how much wheat to produce or the baker can base decisions on how much bread to bake. The formation of prices in the food system and how price formation affects the decisions of the economic agents who are a part of the system is a major focus of this course (e.g., lessons 3 and 4).
Risk bearing – Farming is a risky business. We shall talk about the risks involved in producing food in this course. One of the functions performed by markets in the food system is to help farmers and others manage risk, particularly the risks associated with fluctuations in prices of commodities (lesson 13).
Summing Things Up: Essential Components of the Food System
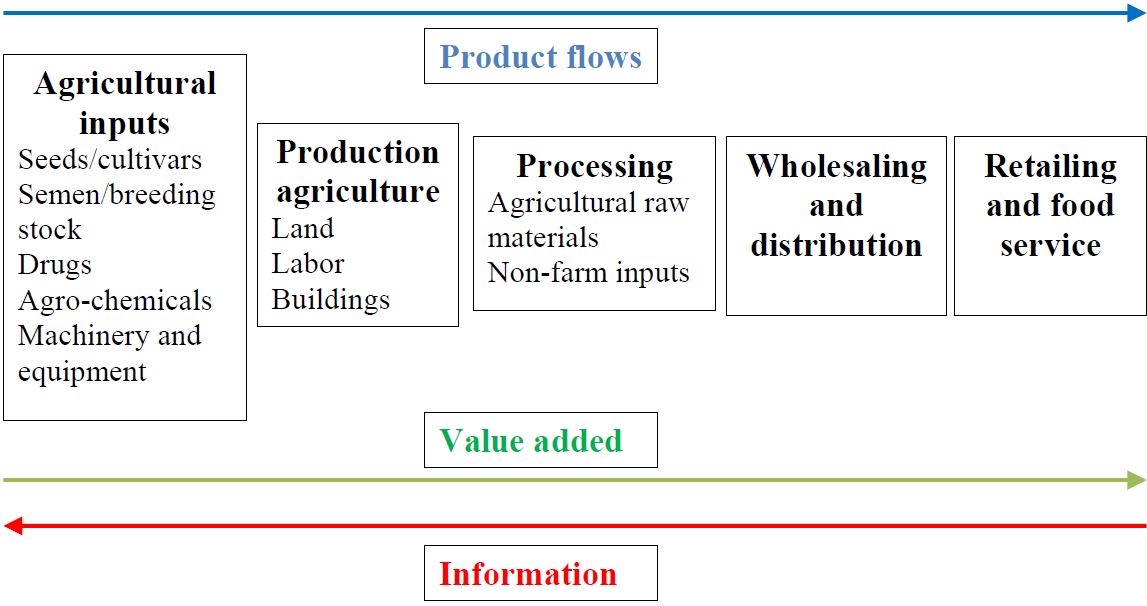
The essential elements that make up the food system are summarized in the figure above.
Economic agents provide a range of inputs needed by farmers to produce the crops and livestock products that are the basis of the food system. Farm inputs range from seeds and breeding stock, to agro-chemicals (such as fertilizer and plant protection products used to control pests and disease), as well as machinery and equipment.
Farmers take these inputs and use their land, labor and buildings to produce agricultural products such as wheat or livestock such as beef cattle.
The farm products are usually combined with non-farm products by processors to transform them into forms that are suitable for human consumption. The amount of processing can vary considerably. There is a big difference between the processing involved in making apples ready for consumption (typically sorting, grading and packing) and that involved in assembling the ingredients for a microwave dinner.
Processors will typically deal with wholesalers or food distributors who deliver products to retailers and the food service industry (restaurants etc.).
All these steps mean that products flow through the food system from left to right in the diagram. As products flow through the system value is added to them. We saw this in the case of bread, where value was added to wheat as it was transformed into flour and then into bread and then provided to consumers in stores. The value adding process is also from left to right in the diagram.
There is an important flow that goes the other way in the diagram and this refers to information. The last link in the food system is us – the consumers of food. The decisions that we make about what we purchase provides information to retailers and the food service industry on which they base their decisions about supplying food products to us. They act on that information by ordering products from wholesalers and food distributors. Those orders will be transmitted to food processors and so-on back down the food system. Ultimately they affect the decisions of suppliers of inputs to farmers – the economic agents at the very end of the food system.
Let’s consider an example of how this works. Suppose that consumers decide they do not want to buy bread made from wheat any more. Maybe they have decided that cornbread is the only type of bread they want to consume. Supermarkets will stop ordering wheat bread, since they do not want to have unsold wheat bread cluttering up their shelves. Food wholesalers will stop ordering wheat bread from bakeries (the processors) and bakeries will stop ordering wheat flour. They will be more interested in buying cornmeal to make corn bread. Wheat farmers will not have much of a market for wheat. They could still sell some wheat for use as animal feed perhaps, but they will reduce the amount of wheat they grow. All the input suppliers that are tied to wheat production will also cut back their operations in response to the fall in wheat production.
So, at the end of the day it is consumers – what we decide to purchase – that provide the signals to the participants in the food system about what they should be supplying. It is important to realize that consumers are in the driving seat in the food system.
The Marketing Bill and Farmers’ Share of Food Expenditures
We have looked at the functions that markets perform in the food system and that value is added to agricultural commodities as they are transformed and moved through the food system to consumers.
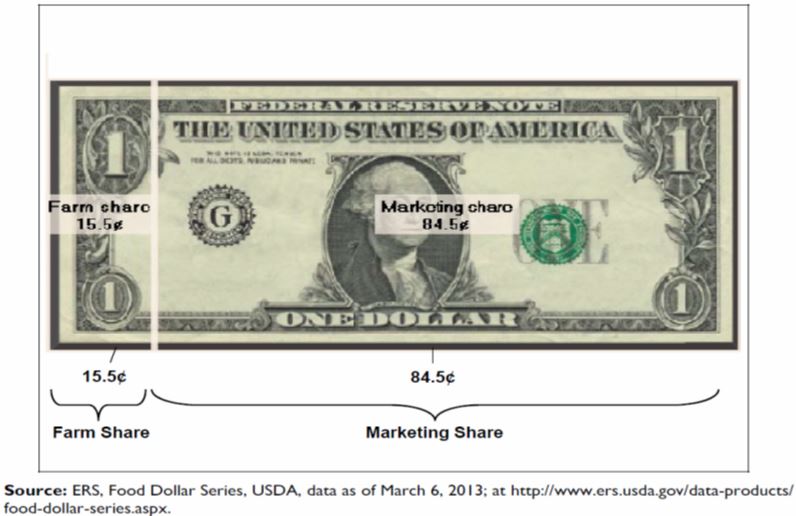
On average, the US farmer receives 15.5 cents of the sales value of food products consumed in the United States. The marketing functions that we talked about earlier take up 84.5 cents of each dollar that US consumers spend on food.
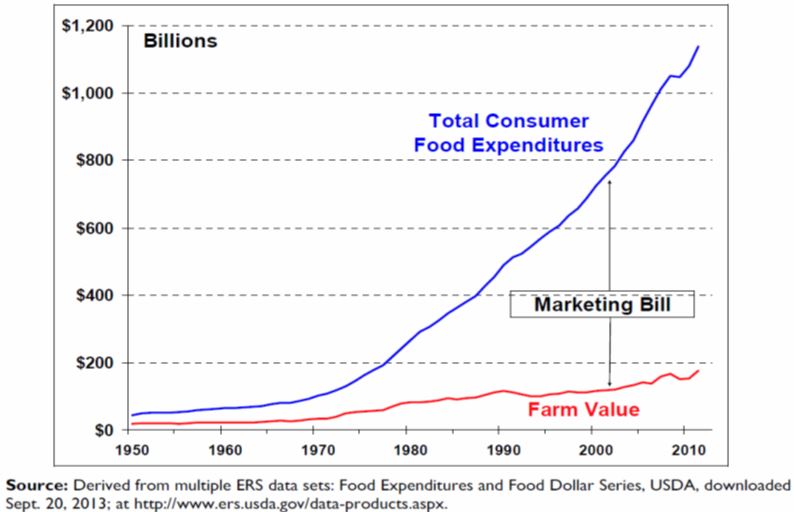
The marketing bill – the cost of all the functions beyond the farm gate - has increased more rapidly than the farm value of agricultural commodities. In 2011 the farm value of food was around 177 billion dollars, but 963 billion dollars was involved in transforming raw agricultural commodities into food products and delivering them to U.S. consumers through retail stores, restaurants, and other consumer outlets.
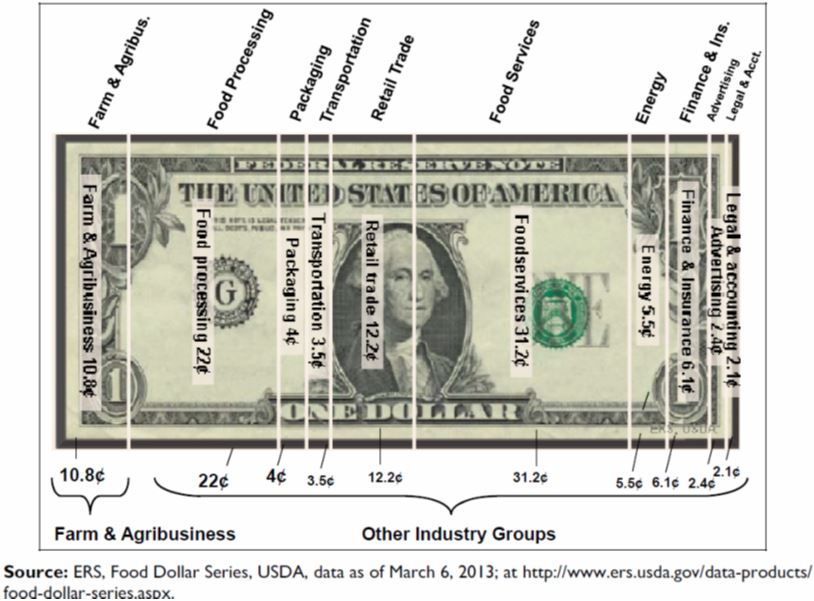
One way to break down the consumer dollar is by industry group, e.g., farms and agribusinesses, food processing, retailing and food service. The picture shows that the largest share of the consumer cost of food is generated by processing, and by distribution (retail trade and food service). These collectively accounted for over 65 cents of each dollar spent on food by consumers. The balance was made up by other functions such as transportation, packaging and energy use, and by other components such as advertising, finance and insurance and legal services. The farm and agribusiness value in this breakdown is less than the farm value in the earlier chart, since farms and agribusinesses must pay some of these additional costs (e.g., for energy and financing) in producing agricultural products.
Does the large share of the dollar taken by industries beyond the farm gate mean that these industries are making high profits? We do not have an estimate for 2011, but in 2006 the profits of businesses beyond the farm gate (processing, distribution, retailing and food service) were estimated to account for roughly 4.5 cents of the consumer’s food dollar. That does not seem to be an excessively large share. In fact, processing and marketing food can be a very low margin activity. The average supermarket makes around 1 cent in profit on every dollar’s worth of product that it sells. Pre-tax profit margins for full service restaurants are around 2 cents per dollar of sales. We shall look at these parts of the food system and what affects their profitability in lesson 7.
The share of consumer value that farmers receive differs substantially by product. It is high when relatively little processing is required. For example, the farm share of eggs (see table) is around 54 percent. In contrast, farmers receive a smaller share of the value of products that are highly processed. They obtain around 17 percent of the consumer value for processed fruit and vegetables and only 8 percent of the value of cereals and bakery products. We have already seen how that small share paid to farmers plays out in the case of bread.
| Food Groupa | 3-Year Averageb | Farm Share (%)c | Marketing-Bill Share (%)d |
|---|---|---|---|
| Eggs | 2010-2012 | 53.7 | 46.3 |
| Beef | 2010-2012 | 49.4 | 50.6 |
| Broilers (composite) | 2010-2012 | 42.5 | 57.5 |
| Pork | 2010-2012 | 31.4 | 68.6 |
| Fresh Fruit | 2009-2011 | 30.0 | 70.0 |
| Dairy | 2009-2011 | 29.4 | 70.6 |
| Fresh Vegetables | 2009-2011 | 27.6 | 72.4 |
| Fats & Oils | 2007-2009 | 24.0 | 76.0 |
| Processed Fruits & Vegetables | 2006-2008 | 17.0 | 83.0 |
| Cereals & Bakery Products | 2007-2009 | 8.3 | 91.7 |
| Total Market Basket | 2009-2011 | 15.2 | 84.8 |
Source: Derived from ERS data sets: Price Spreads from Farm to Consumer (http://www.ers.usda.gov/data-products/price-spreads-from-farm-to-consumer.aspx) and Meat Price Spreads (http://www.ers.usda.gov/data-products/meat-price-spreads.aspx), USDA, downloaded Sept. 23, 2013.
- Includes foods purchased for at-home consumption only. Farm values for fresh fruits and fresh vegetables are based on prices at first point of sale, and may include marketing charges such as grading and packing for some commodities.
- Most recent three-year period with available data.
- The value of the farm input contained in a retail food product, expressed as a share of the retail price.
- The difference between the retail food price and the farm share expressed as a share of the retail food dollar.
Where commodities are produced is key factor in determining how the food system functions. So it is to this issue that we now turn in the remainder of this lesson.
The Location of Production
This part of the lesson will look at the location of production for some of the major agricultural commodities in the United States and what determines this.
According to the latest Census of Agriculture (2012) the United States has roughly 915 million acres of land in farms (370 million hectares), which is roughly 40 percent of the total land area. Cropland makes up about 43 percent of the farmland; the rest is mainly used for pasture.
The United States is climatically diverse. In the 48 contiguous states (that is excluding Alaska and Hawaii) the climate can range from hot arid desert and semi-arid cold steppe climate and from cool humid to humid subtropical. Annual precipitation can vary across the country from less than 5 inches (13 cm.) to over 100 inches (2.5 meters).
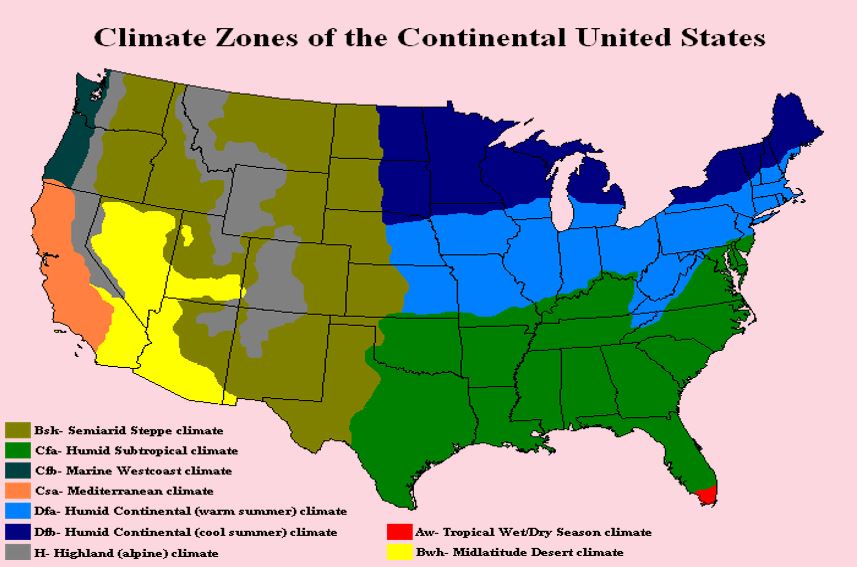
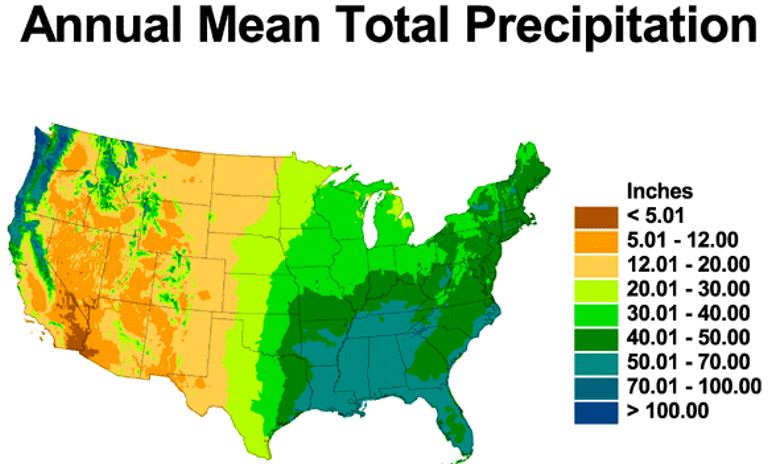
The U.S. Natural Resources Conservation Service (NRCS), which is part of the US Department of Agriculture (USDA), classifies soils into capability groupings that indicate their suitability for farming. The groupings are based upon such factors as the composition and limitations of the soils and the risk of damage when they are used. Prime farmland, as defined by USDA, is land that has the best combination of physical and chemical characteristics for producing food, feed, forage, fiber, and oilseed crops and is also available for these uses. Based on this classification, we can see that in the United States much of the prime farmland (see map) is concentrated in the Central and Eastern parts of the country. The Midwestern states of Illinois, Indiana, Iowa, Kansas, Michigan, Minnesota, Missouri, Nebraska, Ohio, North and South Dakota and Wisconsin have some of the richest soil in the United States and a very favorable climate for agriculture (good supply of moisture and warm summer temperatures).
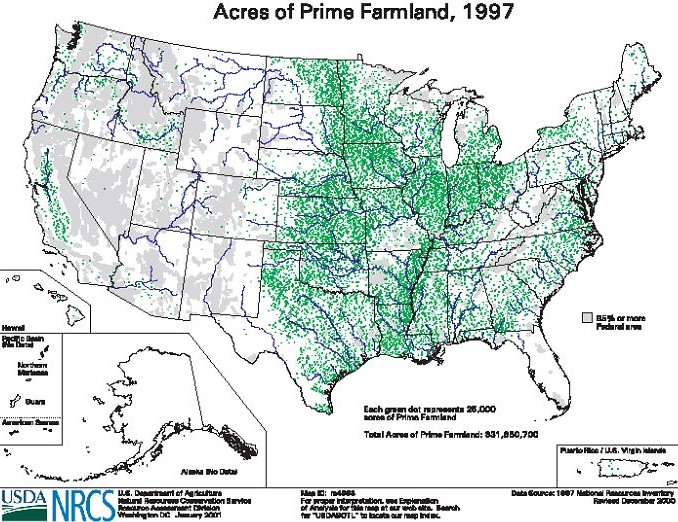
We can see what this endowment of good soils implies by looking at the distribution of some of the major crops in the United States.
Crop Production
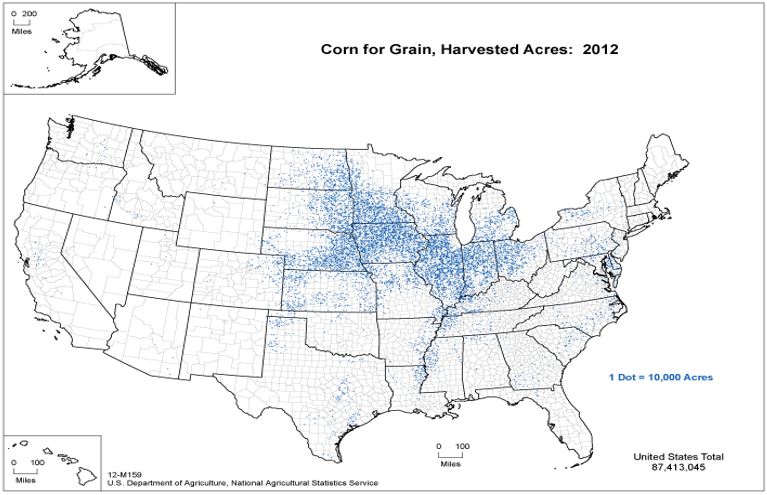
Corn (or maize as it is commonly called in many countries) is a major cereal grain grown in the United States. Corn is widely believed to have been domesticated (adapted for agricultural use) in Mexico as early as 9,000 years ago. The crop makes up over 95 percent of the feedgrain produced in the United States (grain grown for feeding to livestock). Corn is a major source of feed for beef and dairy cattle, swine and poultry. In recent years there has been a substantial increase in the use of corn to produce alcohol (ethanol) for fuel use (see chart). The distillers’ grains, which are a by-product of the process of making ethanol, are also fed to livestock.
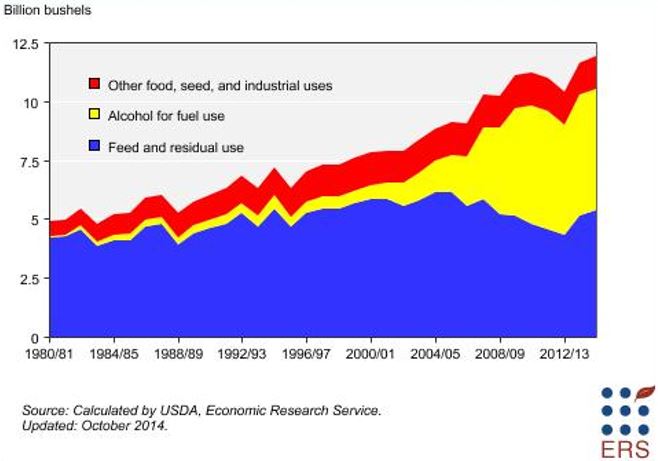
Corn places heavy demands on the soil. The plant needs lots of nitrogen to produce good yields. As a result, corn is often grown in rotation with other crops, particularly soybeans, which also grow well in the same climatic conditions as corn. Soybeans are leguminous, which means that their root systems contain bacteria that transform nitrogen from the atmosphere into a form that can be used by plants. If soybeans are grown on a plot of land one year and corn is grown on that land the next year, the amount of nitrogen fertilizer that has to be added to the soil to produce corn is reduced. Crop rotation has other advantages, such as controlling bacterial and fungal diseases and pests that can build up if the same crop is produced year after year on the same piece of land.
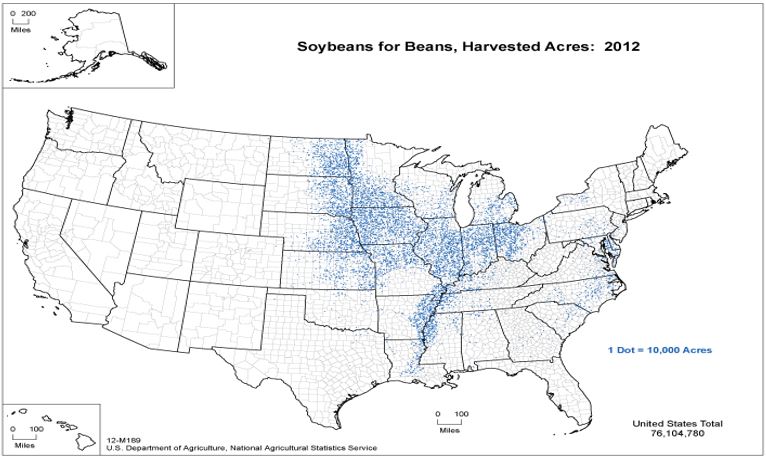
So it is perhaps not surprising that we see a similar pattern for the location of soybean production in the United States as we do for corn. In this case, in addition to climate and soils, good farming practices have a lot to do with the location of production of this crop.
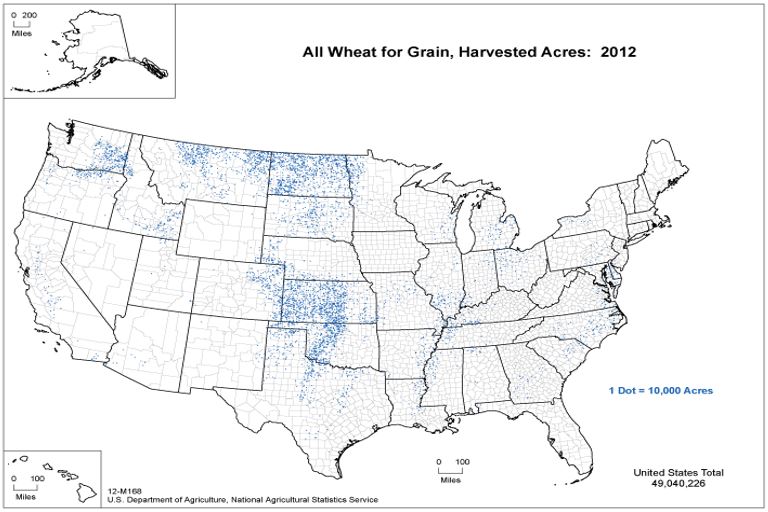
Wheat is another crop for which location is influenced strongly by climatic conditions. The map of climate zones shows as that you move westwards from the Corn Belt states, precipitation declines. Corn is generally not grown in areas receiving less than 25 inches (60 cm) of annual precipitation; for high yields at least 18 to 20 inches (45 to 50 cm) of moisture should be available during the growing season. Wheat, on the other hand needs only 12 to 15 inches (31 to 38 centimeters) to produce a good crop. Wheat grows best when temperatures are warm, from 70° to 75° F (21° to 24° C), but not too hot. Wheat also needs a lot of sunshine, especially when the grain is ripening. Areas with low humidity (humidity is often high during the summer in the Corn Belt) are better since many wheat diseases thrive in damp weather.
So as we can see from the map wheat tends to be grown in drier areas in the United States to the west of the Corn Belt. Again, climate is a big factor in the location of production.
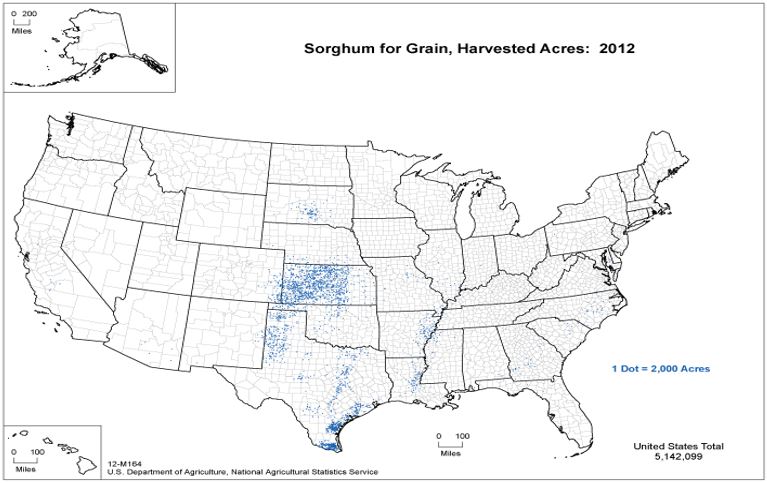
Another crop for which location is influenced strongly by climate – and in particular the lack of moisture is sorghum. Sorghum is a drought-tolerant and heat-tolerant plant that can be fed to livestock as an alternative to corn. Sorghum requires much less water than corn so it tends to be produced where water is scarce. Kansas is the leading state for producing sorghum (it is called milo by farmers), and the crop is also popular in Texas, where moisture is often scarce.
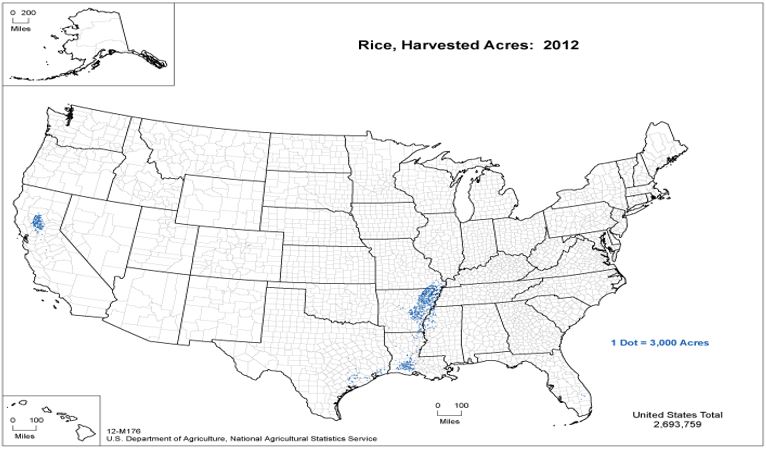
Some crops require a lot of water to grow in addition to high temperatures. One such crop is rice. Although the United States accounts for less than two percent of the world’s rice production, it ranks among the top five rice exporting countries. The leading rice producing state of Arkansas is able to obtain the large amount of water that the crop needs from the Mississippi river. The second leading state (California) uses irrigation to produce the crop. Other rice-producing states are Louisiana, Mississippi, Missouri and Texas. So in this case crop location is partly due to climate, but also has much to do with geography – particularly the presence of relatively flat land and access to water that can be used to flood that land.
Another crop that needs a lot of water is sugar. The United States produces sugar from sugarbeet, the root of which contains a high concentration of sugar, and sugarcane, in which sugar is contained in the stalk. Sugarbeet needs a temperate climate, while sugarcane needs a tropical or sub-tropical climate.
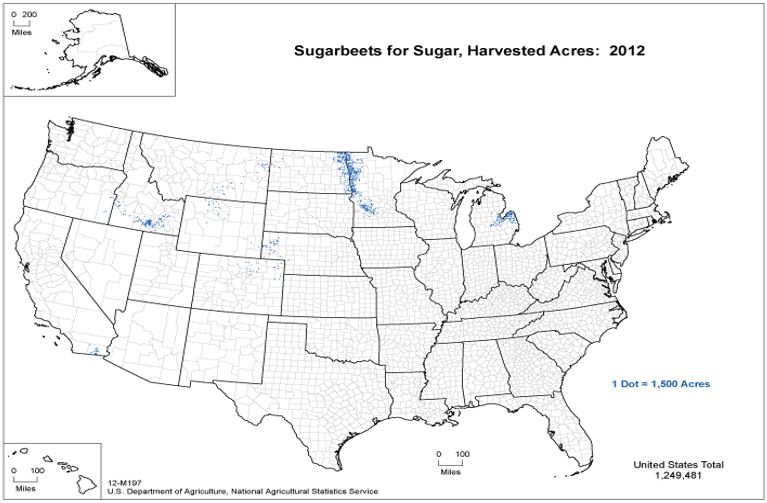
The map shows two main areas in which sugarbeet production is concentrated. One is the Red River Valley that borders the states of North Dakota and Minnesota, and the second is in Northern Michigan. Both of these areas have cool climates that are favorable to the growth of this crop.
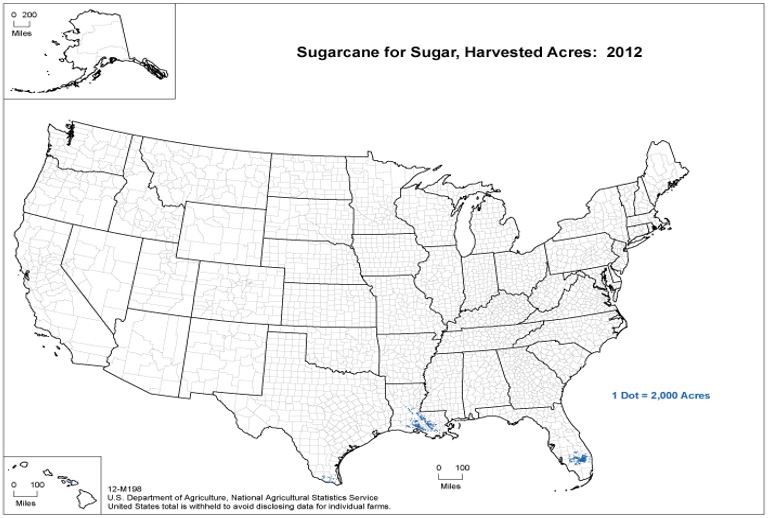
Sugarcane production is largely concentrated in the warm southern states of Florida, Louisiana and Texas. These states have access to water for the crop and the subtropical climate that it needs.
So the location of sugar production in the United States is also primarily related to geography and climate.
Livestock Production: Cattle, Calves, and Swine
We have now looked at many of the important crops produced in the United States and where production is located, but how does livestock fit into the picture?
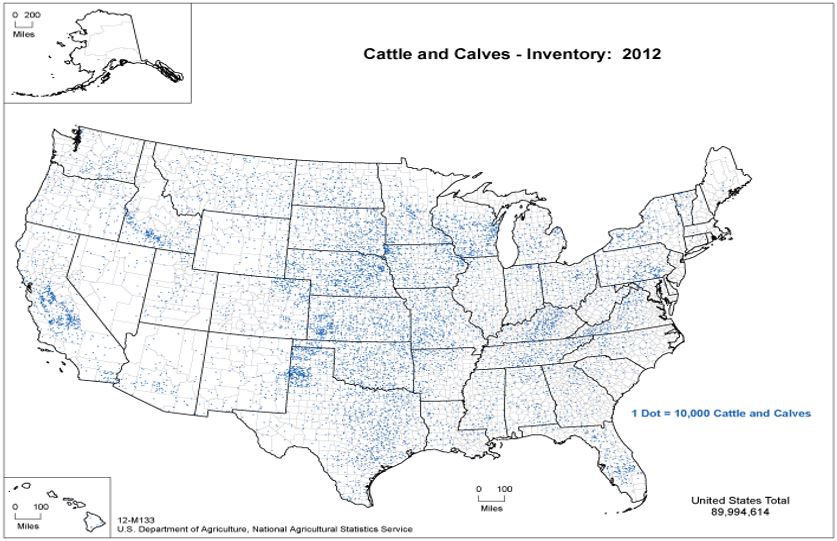
The United States is a major producer of beef and dairy products. Cattle and calves are widely dispersed throughout the country.
The United States has the largest fed-cattle industry in the world. Fed cattle refers to animals that are raised to slaughter weight in a feedlot (an area or building where animals are kept) where they are fed concentrated feed – feed that that is high in energy and protein, such as a mixture of corn and soybean meal (the product that is left after the oil is extracted from soybeans through crushing). This is in contrast to some other major beef producing countries, such as Australia and Brazil, where beef cattle are primarily raised by grazing on forage, primarily grass. A lot of the beef production takes place in the central part of the United States – in the states running from North Dakota south through Texas. If you look at the maps for corn, sorghum, and soybeans you will see that a lot of their production takes place in these central states or states that are close by.
It takes a lot of feed to raise a beef animal to its normal slaughter weight of around 1,250 pounds (around 565 kilos) in a feedlot. A typical figure is 5.5 to 6.5 pounds of feed per pound of weight gain. So it makes sense to raise beef cattle close to feed supplies. For most types of livestock, particularly those that are primarily raised for meat, you will find that the primary determinant of where the animals are located is where sources of feed are located.
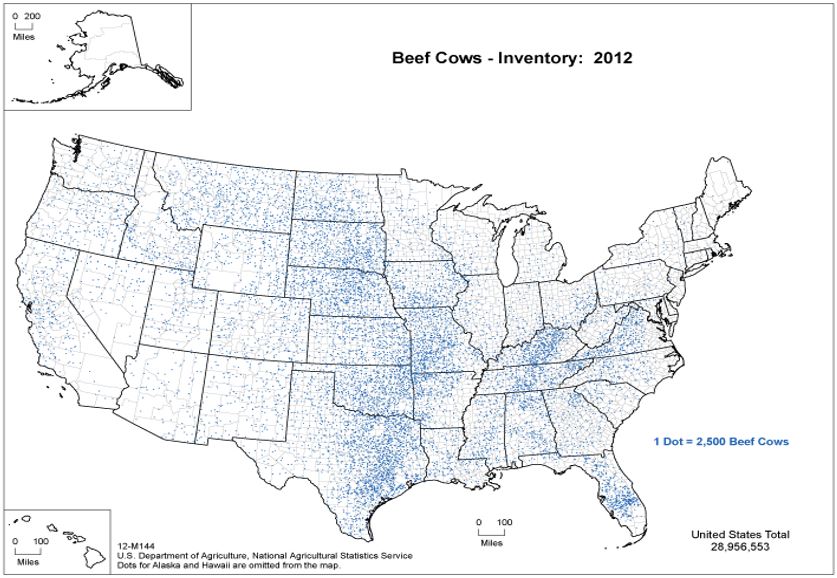
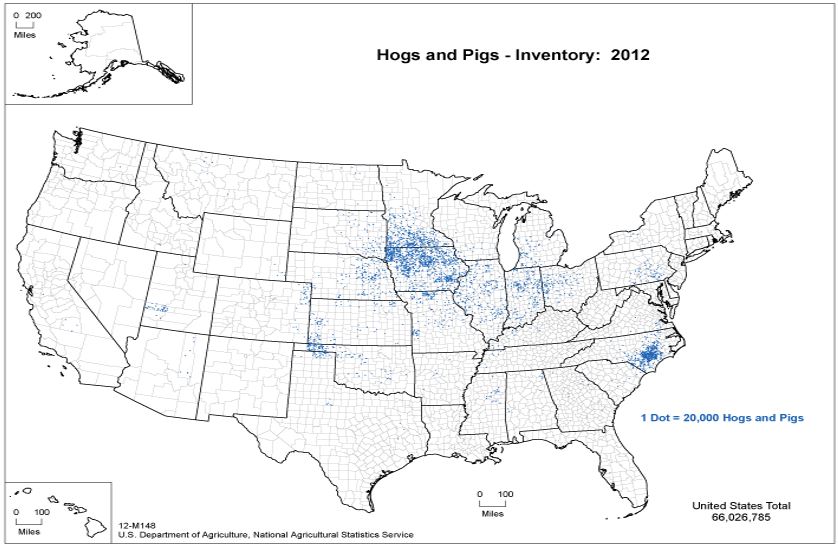
We can see this clearly when we look at swine (hogs and pigs) (hog is a generic term for all swine and a pig is a young hog). The map shows that many of these animals are concentrated in the Corn Belt area, where there are ample supplies of corn and soybeans (see those maps).
Over the last 20 years or so there has been a major expansion of swine production near to the east coast of the United States in North Carolina. Although this area is not so well endowed with feed, good transportation systems combined with a range of local economic conditions, including low labor costs and less stingent environmental regulations, have contributed to the development of large scale hog operations in this area. Potential pollution from large concentrated feeding operations has become an increasingly important issue and this is affecting the location of such operations in the United States. So this is an example of how policies and economics can interact to determine the location of agricultural production.
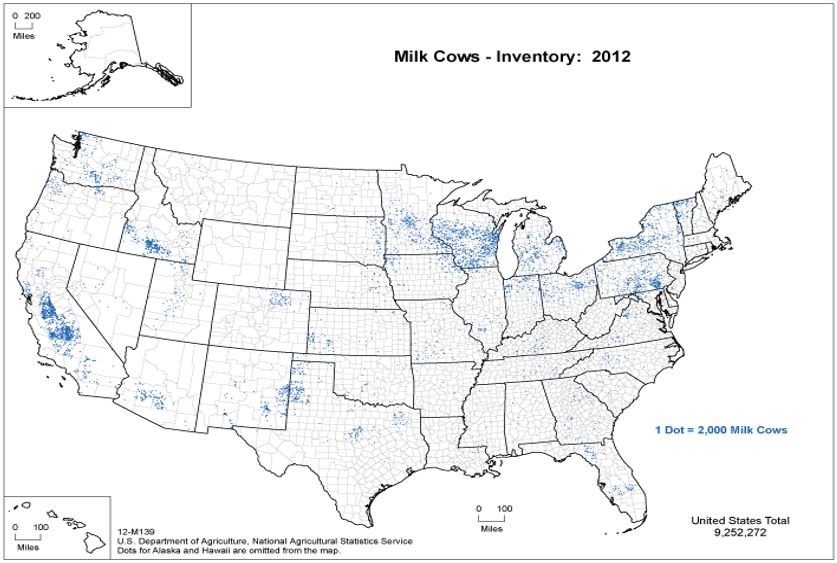
Dairying is a major part of US agriculture. The farm value of milk production is second only to beef among livestock industries and is equal to corn. Milk is produced in all 50 States, with the major producing States in the West and North.
Traditional dairy farming areas are in the northeast and mid-west, where a temperate climate and availability of feed stimulated the development of this type of agriculture. Midwestern states such as Wisconsin and Michigan and Northeastern States such as New York and Pennsylvania have traditionally had important dairy industries. But, as in the case of swine, the development of large scale dairy farms has taken place in other areas, particularly in western states such as California and Idaho, largely for environmental reasons. The average dairy farm in the United States has around 115 cows but the number of farms with more than 500 animals has been increasing rapidly. In 2009, 30 percent of the total number of milk cows in the United States were in in herds of 2,000 animals or more; 56 percent were in operations with more than 500 animals and these farms accounted for almost 60 percent of the milk produced. Large dairy farms generate a lot of manure and it is preferable to locate these away from heavily populated areas.
Overview of the United States Dairy Industry
So as is the case for swine, the location of milk production in the United States is influenced by climate and feed availability, but also by other factors, such as environmental regulations and economic factors that favor the development of large scale operations. We shall look at some of the economic forces that favor large farms in lesson 05.
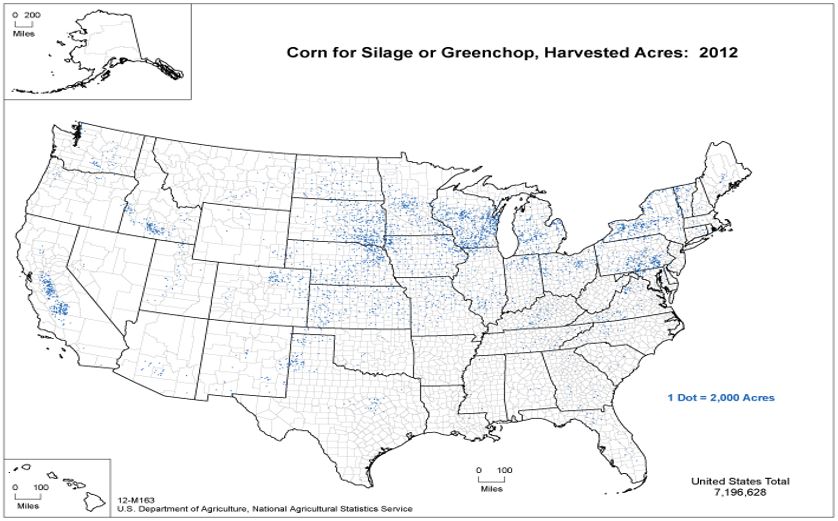
Corn silage – a fermented, high-moisture fodder – is often fed to dairy cattle as well as to beef cattle. As we can see from the map a lot of the corn silage produced in the United States is in dairy states.
Livestock Production: Poultry
To conclude our review of the location of livestock production we take a look at poultry – chickens raised for meat (these are called broilers in the United States), turkeys and finally laying hens.
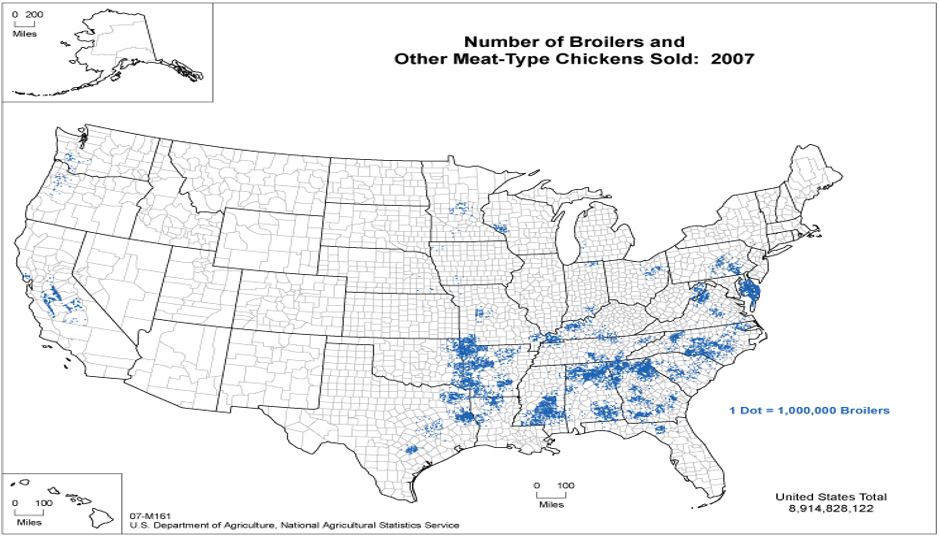
The broiler industry began in the 1930s in the Delmarva Peninsula (the large peninsula on the east coast that is occupied by most of the State of Delaware as well as portions on Maryland and Virginia), as well as in Georgia, Arkansas and New England. These areas had access to feed supplies. Some (e.g., Delmarva) were also located close to major centers of population which provided a large nearby market. The growth of large broiler operations – typical large farms may have four to six houses for the birds, each of which may contain 25,000 birds – has been pronounced. The industry has tended to develop in the southeastern states of the United States because the warmer temperatures there are more favorable to raising poultry and the labor needed to look after the birds is cheaper.
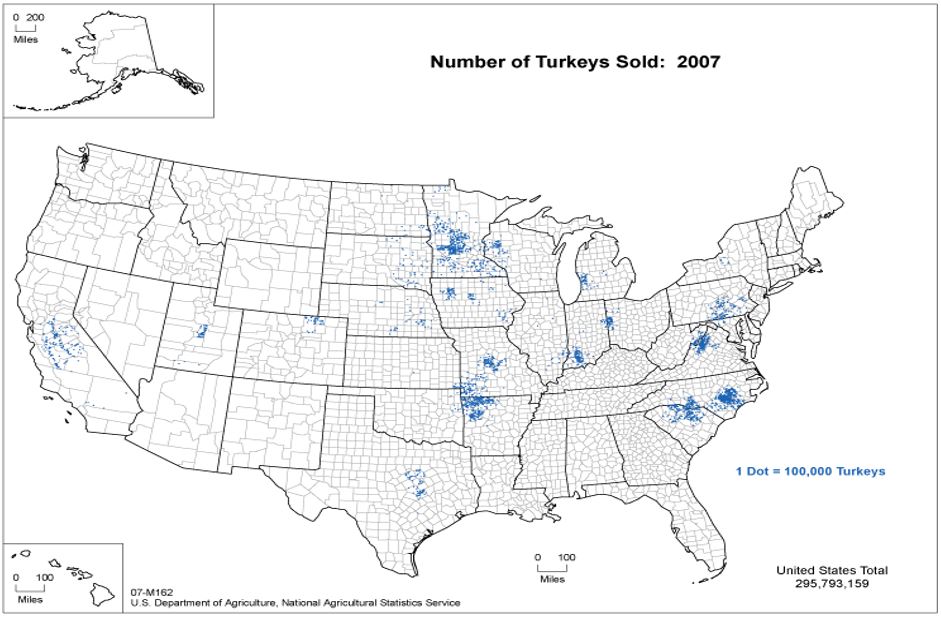
Some turkey production takes place in states where broilers are also important (e.g., North and South Carolina and Arkansas, but there are major centers of production further north. Minnesota, for example, is the leading state for the production of turkeys. Ample feed is available to feed the turkeys. Chickens were grown in Minnesota in the 1920s but turkey farming was later encouraged by local processors who determined that turkey production was more profitable. In this case tradition has played a role in the location of the industry. The same factor applies to other parts of US agriculture, for example, dairying.
We saw previously that dairying is widespread across the upper states of the Midwest and the northeastern part of the United States. Even though dairy farming has expanded in the west in recent years with the creation of some very large dairy farms, the strong tradition of dairy farming in traditional production areas is a powerful force and underpins the continuation of smaller scale dairy farms in other areas.
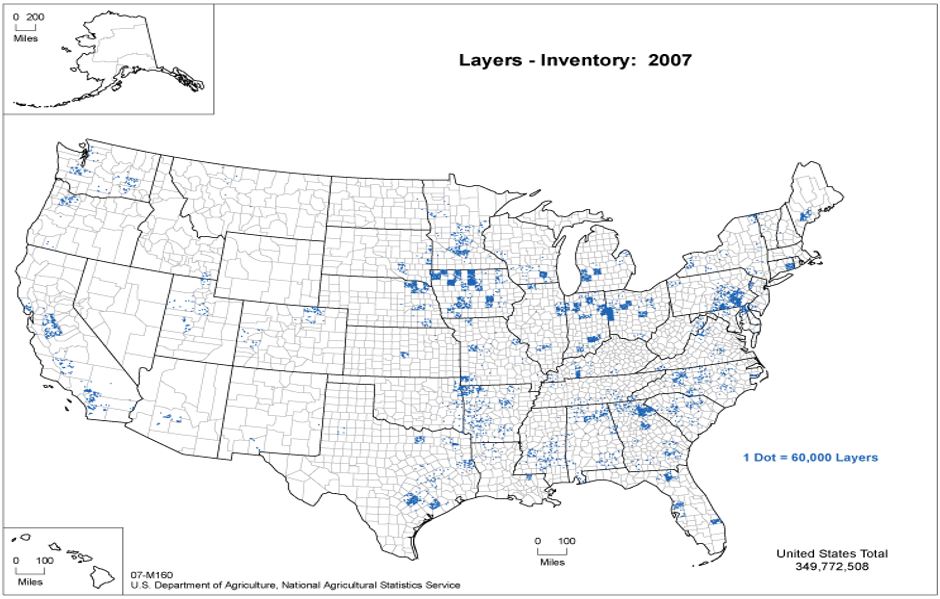
The final part of the poultry industry – egg production – is widely scattered throughout the country. An important reason for this is that fresh shell eggs (as opposed to processed eggs used in a variety of food products) are fragile, bulky and costly to transport. So there are strong economic reasons to locate egg production close to major markets – in other words close to where egg consumers live. For this reason we see substantial clusters of egg production close to urban areas in California, Florida, New York, and Texas, as well as in other states. So in this case – where consumers are located is a major factor affecting the location of agricultural production.
Consumer Location
The location of consumers is a major factor affecting the location of processing of many agricultural commodities, particularly commodities with high value-added (lesson 6). For example, let’s consider milk production.
- Eastern United States: Much of the milk produced by dairy farms in the eastern part of the United States goes into making fresh products - fresh milk, cream, yogurt etc. These soft dairy products (products that cannot be stored) are sold in the large urban markets of Boston, New York, Philadelphia and Washington, DC.
- Wisconsin: In contrast, in Wisconsin, much of the milk produced goes into making hard dairy products, particularly cheese. Cheese and other hard dairy products can be stored. With around 14 percent of the nation’s milk production, Wisconsin accounts for more than 25 percent of the nation’s cheese production. With the exception of the Chicago area, Wisconsin is located relatively far away from the major centers of population, so it makes sense to use milk to produce dairy products that can be stored and transported long distances. Cheese is ideal for this purpose.
- Western United States: A lot of the milk produced on the large dairy farms in the western United States also goes into producing hard products such as cheese and butter. Less than 30 percent of the total supply of milk in the United States is consumed as fresh milk or cream; the remainder is processed into a range of products such as butter, cheese, frozen dairy products and milk powders.
Ice cream is often made close to where consumers are located so that the supply can respond to local changes in demand – the consumption of ice cream is highly seasonal, with most of the consumption occurring in the summer.
- California, with a population of 38 million, is the leading producer.
- Production is also significant in states located close to centers of population in the east and Midwest.
- However, Texas, with its population of almost 27 million and is not a major dairying state, is the fourth largest producer of ice cream.
So in this case, the location of production is not only affected by where consumers are but by the characteristics of consumption. Many processed food products share this feature – regional food preferences are often important in influencing the location of food processing.
Summary of Our Tour
The maps show that agricultural production is often concentrated in particular areas. This reflects the fact that agriculture is becoming increasingly specialized – farmers are tending to specialize in the production of particular products and as a result regions are becoming more specialized in production. We shall examine why this is so when we look at the economics of farm production in lesson 5 and the effect of the economics of transportation in lesson 11.
We can summarize some of the key points that we have made on the basis of our tour of the maps of production of major agricultural commodities in the United States.
Two major factors affect the location of production:
- The location of resources - Soil quality and the availability of water are critical, but the suitability of these resources for the production of particular commodities also depends on climate.
- The location of consumers. For some products, particularly those that can be stored after harvest (e.g., wheat) it is not particularly important to be close to consumers. But for other commodities, particularly perishable commodities or those that are likely to be difficult or expensive to transport long distances, producing close to consumers is very important. We have also seen that other factors – tradition, environmental factors and labor costs can also affect the location of some agricultural activities.
Introductory Survey
To get a better picture of your experiences coming into this course, we have created a survey. You will have a chance to see a snapshot of your fellow students' experiences. This survey is anonymous and optional.