Main Content
Lesson 2: Data Source and Analysis

Data and Tools: How to Perform Market Analysis
In this lesson, I will focus on providing an overview of the types of data and basic tools needed to analyze the market of agricultural commodities.
Before looking at the different data resources at our disposal, let’s talk for a moment about who is going to need/use what resource. In Figure 2.1, you will find a schematic representation of the different analyses that a market analyst can perform to assess changes in market trends. The data requirements, as well as the tools needed to perform each analysis, will differ depending on the type of analysis performed and the selected approach.
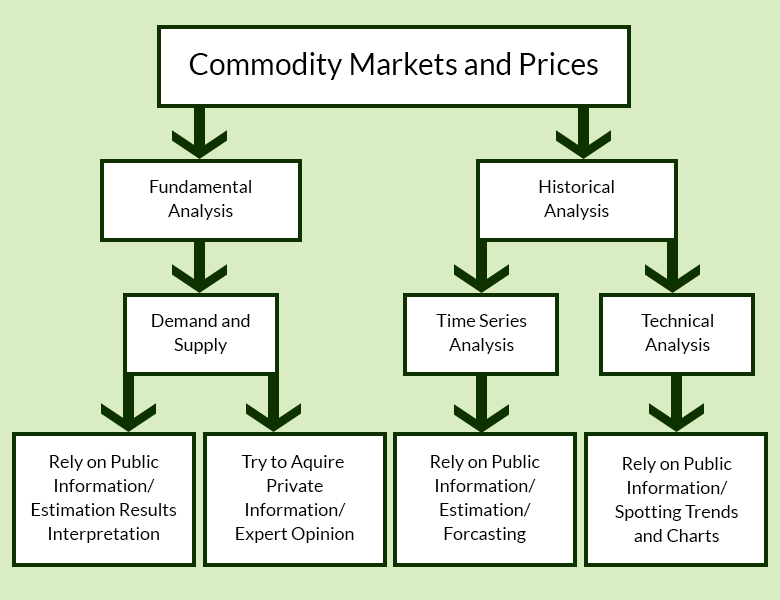
The first distinction to note is if the analyst focuses on changes in commodity demand and supply (fundamental analysis), or if the focus is instead on previous figures and information in order to assess future price fluctuations (historical analysis). Traders who use a fundamental analysis rely on supply and demand information, either reports/private information or data, which is analyzed using either descriptive or more advanced statistical tools. Analysts who uses historical analysis rely heavily on long data series of previous information and statistical methods (time series analysis), or alternatively, on qualitative methods based on spotting patterns on charts (technical analysis). In the explanation that follows, I will illustrate briefly how these approaches work to set the stage for the remainder of the course.
Fundamental Analysis
Fundamental analysis is based on the study of supply and demand movements and how they affect prices. Market analysts relying on fundamental analysis gather their information from a series of different resources, including the United States Department of Agriculture (USDA) and its services such as the National Agricultural Statistical Service (NASS). The analysis of data sources from NASS will be covered in detail in this lesson as well as in the lessons that follow.
Market Reports: USDA’s National Agricultural Statistics Service
Often, analysts rely on publicly available reports. Several full market reports and general information on the market for commodities are available from the USDA. Go to the USDA’s National Agricultural Statistics Service website, where you can download general information/data for different commodities:
- To view statistics by subject, select a sector, followed by a group and commodity. Let's select "Crops," "Fruit and Tree Nuts," and Apples.
- Set the type of report you are interested.
- Under "Choose Data Items," select the checkbox for “Apples – Production, Measure in LB.”
- Click the Continue button.
- On the next screen, you will see some national production statistics (click “more” on the table to see more data). You'll also see a series of likely publications, charts, and graphs where you can access more information.
- From the list of publications, select Noncitrus Fruits and Nuts - Jan Preliminary and July Annual.
- You will be redirected to a page containing a repository of reports, including annual and semi-annual reports for the production of fruit (excluding citrus) and nuts. The January reports contain a preliminary summary of last year’s market figures (sometimes redacted and corrected in February and/or March), while the July report presents the “final” figures. Please note that most market reports are PDFs, which makes their data not readily usable for further analysis. The reports also come in text file format; all the tables are available in ZIP folders for easier access.
Let's try another example: Let's say that you were looking for information on the mushroom market, prices, production, number of growers and utilization (both Agaricus and specialty types). The appropriate selections from the USDA’s National Agricultural Statistics Service website will take you to annual reports for this market. As an exercise, try to retrieve this information yourself.
You should reach the following section:
Market Reports: USDA Economic Research Service
Another avenue to obtain market information for different types of agricultural commodities (as well as assistance programs, farm economies, etc.) is through the USDA Economic Research Service website.
From there, you can access different types of information for animal products, crops, and most importantly for the focus of this course, markets and prices. You can retrieve information on food markets, food consumptions, and trends that exemplify hot and current trends in the food business, such as local foods, as well as supply chain information beyond the farm-gate (wholesaling, retailing, etc.).
Quick Stats Database
The NASS Quick Stats database is one of the most useful resources for analyzing agricultural commodity markets.
You should notice that there are two versions of the interface: Quick Stats 2.0 (which is the one that you will use) and Quick Stats Lite.
You may want to explore Quick Stats before you access the tutorial later in the lesson. On the Quick Stats Tool page, start by clicking the arrow for Quick Stats 2.0. From there, test out combinations of the various commodity, location, and time options. You should be aware that production statistics are available for both quantity and value for most commodities in the animals and products, crops, and demographics sectors. Information on fertilizers and pesticides can be discovered in the environmental sector. However, keep in mind that not all of the information in the Quick Stats database will be utilized in this course; for example, our main focus in the economics section will be price indexes.
Somtimes, the data you need to complete your fundamental analysis may not be available. In this case, a proxy can be constructed. For example, let's say you want to use data for actual food consumption. You'd want to use a proxy method like the USDA Economic Research Service's disappearance estimate, which essentially considers the total amount of food in the system (production + imports + initial stock), and subtracts the the food that "disappears" from supply (e.g., exports and final stock). This information would then stand as a proxy for the actual amount of food consumed, or the demand. More on this concept will be covered in Lesson 4.