Main Content
Lesson 2: Data Source and Analysis

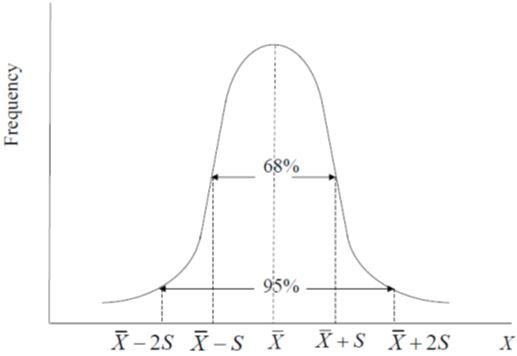
Normal Distribution
A data series is distributed as normal (or follows a normal distribution) if
- its distribution is symmetric around its mean,
- the mean and median coincide (or mean = median),
- it is fully defined by its mean and standard deviation,
- 68% of the observations are within one standard deviation of the mean, and
- 95% of the values are within two standard deviations of the mean.
Large samples of data usually tend to be distributed normally; many consider data distributed normally to be “well behaved” because only the mean and standard deviation are needed to fully describe it
Covariance: A measure of how two variables change together is calculated by the sum of the product of the difference of each observation for a data series and its mean, divided by number of observations minus 1:
Correlation Coefficient: This is a bounded measure of how two variables change together. The correlation coefficient is calculated by dividing the covariance between two variables by the product of their standard deviations:
The main appeal of using the correlation coefficient instead of the covariance is that it is adimensional, meaning that it has no units of measurement. Since the correlation coefficent exists between -1 and 1, it allows the market analyst to quickly assess how much two variables move together along the graph. The larger the correlation coefficient (either positive or negative), the more the two variables vary together. Usually, 0.5 is considered as the rule of thumb to assess how my <<ED: Paragraph incomplete, please revise.