Main Content
Lesson 2: Research & Measurement Basics

Variables & Levels of Measurement
Levels of Measurement
Every variable for which we collect data is associated with a level of measurement. Understanding what the level of measurement is will help you determine how to analyze the data you collect. The four categories of measurement are:
- Nominal
- Ordinal
- Interval
- Ratio
The first two levels of measurement (nominal and ordinal) are referred to categorical because the levels within those variables represent categories. The second two levels of measurement (interval and ratio) are referred to as continuous because there is equal mathematical distance between each level. We will explore this more later as we move through this lesson.
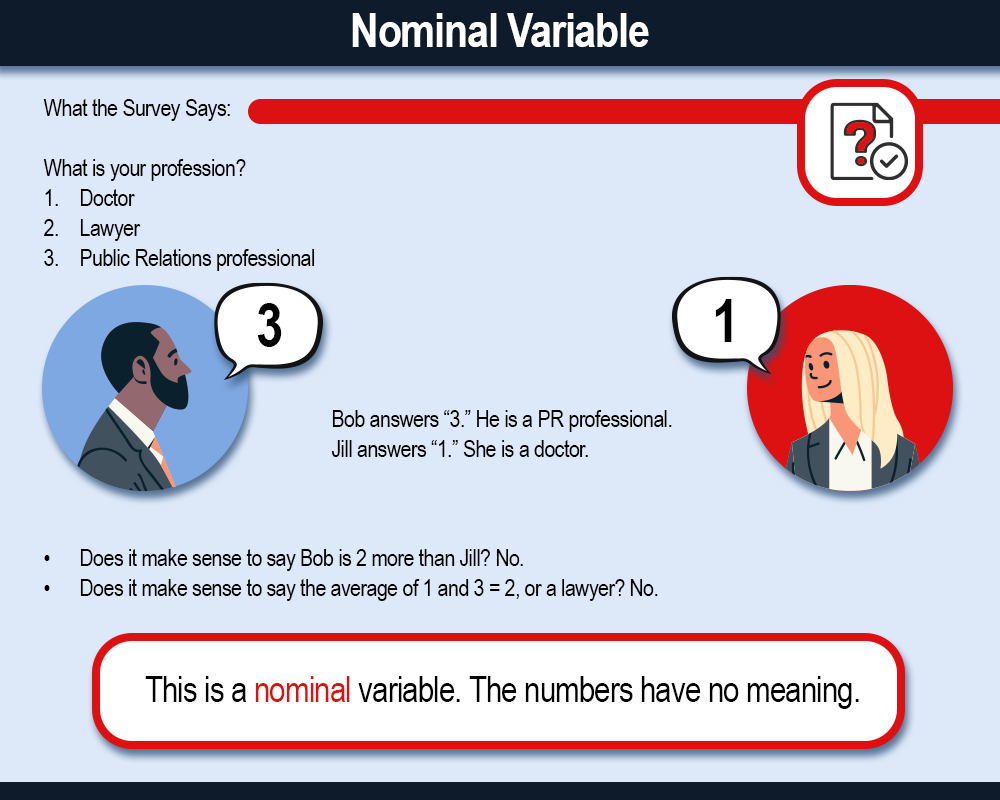
Nominal Level
- Categories have no mathematical meaning. Numbers have been assigned to represent that variable’s categories.
- Many contain two options that we code as 0 or 1. This type of nominal variable can also be referred to a as dichotomous variable.
- Most demographic variables are nominal level.
Example: Take for example the variable “Marital Status.” We can include several options or categories in this variable such as married, never married, divorced, etc. Below we have assigned numbers to the categories, but the numbers have no mathematical meaning. They just allow the researcher to analyze the data more systematically. There is also no ranking. Despite being assigned a larger number, being divorced is not higher or better than never being married.
- Married
- Never married
- Divorced
How can we change this variable to be a dichotomous variable? We collapse categories, so there are only two. In this scenario, we have two simpler categories. The second category would capture everyone who is divorced, has never been married, or is widowed. See below:
- Married
- Not married
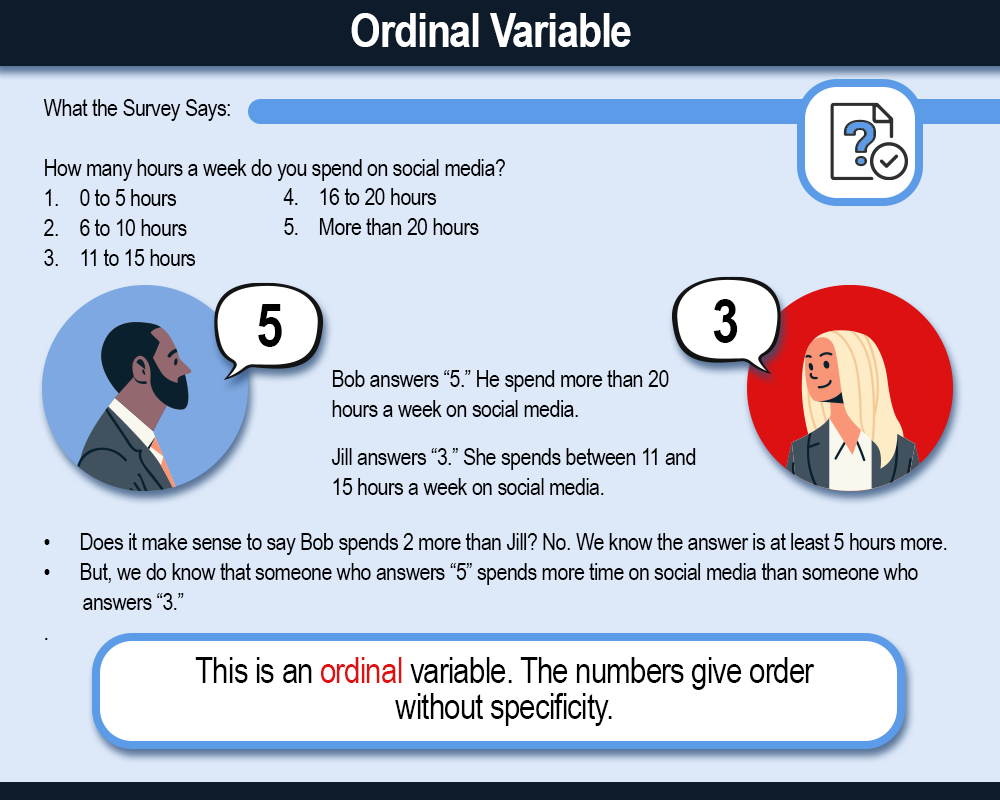
Ordinal Level
Like nominal variables, ordinal variables are also categorical because the levels within a variable represent categories. With ordinal variables, we can begin to sort categories into ascending or descending order. The key distinction between ordinal variables and interval variables (which we will discuss next) is that ordinal variables do not have equal distance between each of the variable’s levels or categories. Let’s go through an example below.
Level of education is traditionally the best example of an ordinal level variable. What level of education have you already completed?
- High school diploma
- Associates degree
- Bachelors degree
- Masters degree
As you can see, the levels or categories of this variable which we can refer to as “level of education” are sorted based on the number of years one would spend in order to complete that degree. For example, if you have a high school diploma, you may go on to complete a college degree. The categories of this variable are sorted, but there is not equal distance between each level. Sometimes, it takes individuals five or more years to complete a bachelors degree and masters degrees can be completed in various amounts of time based on the nature of the program.
Does anything stand out to you about this variable? Spend some time considering that question. You may be asked about it again later in this lesson.
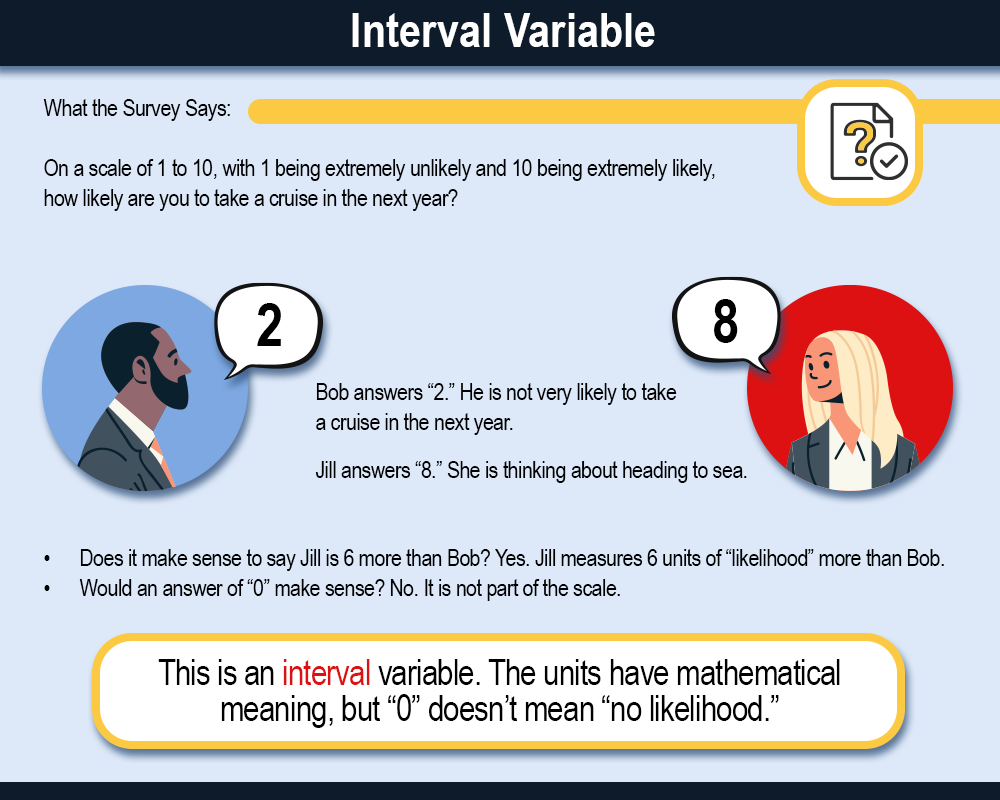
Interval Level
Now that we’ve discussed categorical variables, we can discuss continuous level variables. The first is interval level. Much like ordinal level variables, interval level variables have levels that are ranked. The main difference between ordinal and interval level data is that the levels within an interval variable are meaningful and traditionally are considered equal. This means that we assume that the difference between one level to the next is the same. Let’s explore at an example together.
The most common way that we collect interval level data is through Likert-type scales. Below is an example of a Likert-type scale.
On a scale from (1) Strongly disagree to 5 (Strongly agree) please rate your level of agreement with the following statements:
| Statement | Strongly disagree | Disagree | Neutral | Agree | Strongly agree |
|---|---|---|---|---|---|
| The Netflix series Stranger Things is interesting. | 1 | 2 | 3 | 4 | 5 |
| I enjoy watching the Netflix series Stranger Things. | 1 | 2 | 3 | 4 | 5 |
| I would recommend the Netflix series Stranger Things to a friend. | 1 | 2 | 3 | 4 | 5 |
If a participant received this question in a survey, they would read each statement and select the rating that best applied to their sentiment towards the statement. While there is some debate as to whether scales like this are ordinal or interval, many researchers treat them as interval level. The reason for this is that we assume there is equal difference between each level since we have assigned a numeric value to each level (e.g., 3 = Neutral). While this is an assumption, one benefit of this is that we will be able to do more interesting statistical analyses if we treat this data as interval instead of ordinal level. We will learn more about this in Lesson 3.
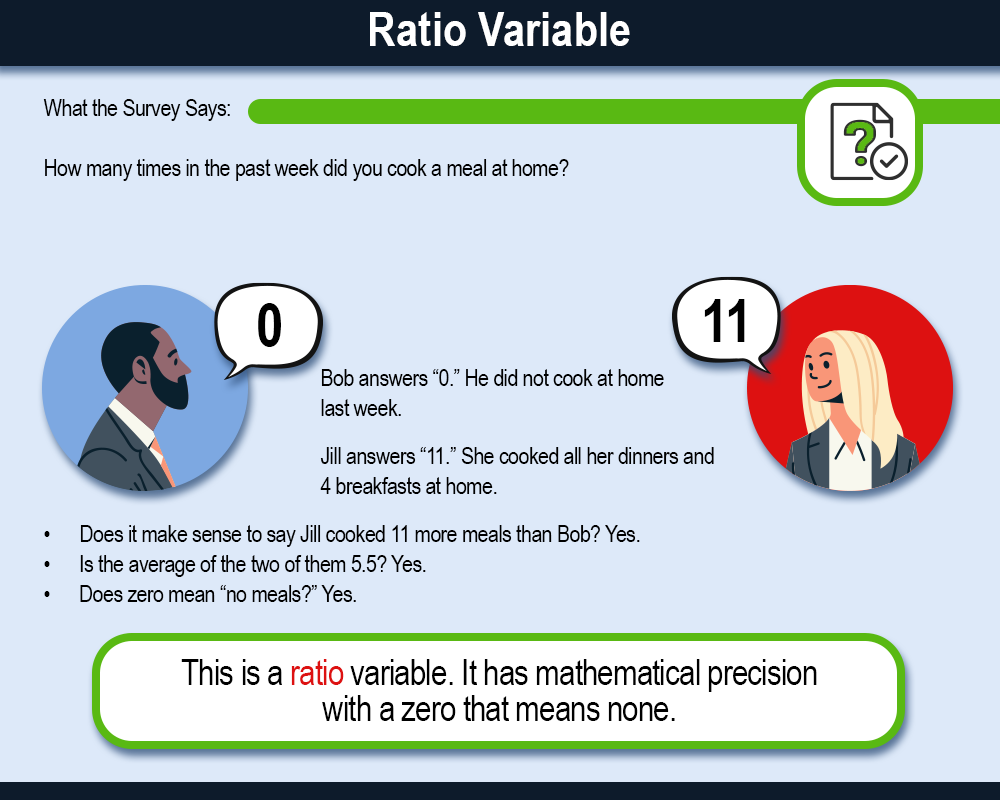
Ratio Level
Finally, ratio level data are also continuous. Ratio level data have all the same attributes as interval level, but they also have an absolute zero. As such, we can produce meaningful ratios using this type of data. Let’s explore an example together.
Websites can track how long their users spend on each page of the website. Users may spend 30 seconds, 120 seconds, or even 360 seconds or more on a page. This type of data is ratio level. It is possible for a user to spend zero seconds on a page. In addition, if a user spends 60 seconds (or 1 minute) on a page they’ve spent half as much time as someone who spent 120 seconds (or 2 minutes). Therefore, we can produce meaningful ratios using this data.