
LHR312:
Lesson 02: Developing the Research Hypothesis and Numerical Descriptions

Lesson 02: Developing the Research Hypothesis and Numerical Descriptions
Overview
This lesson is designed to introduce the process of forming a research topic and developing a research hypothesis. You'll also be introduced to variables as a way to discuss behavior and numerical measures as a way to describe behavior.
Lesson Readings & Activities
By the end of this lesson, make sure you have completed the readings and activities found in the Lesson 02 Course Schedule.


When you're developing a research hypothesis or even just figuring out what it is you want to study, there are some main things you should be aware of. To be perfectly honest, the best way to decide what you want to study is to look at the world around you, and through that observation, figure out what is the most important and interesting research question. A big part of this process is also to understand that the scope and depth of your question must always be limited to what you can actually do. That is, you may want to understand why people do what they do. But this question is incredibly broad. You might make the case that this question is the root of all of behavioral science, and so you must narrow your objective to something manageable. This hypothesis development comes naturally to some, but do not feel discouraged if a research question doesn't immediately come to mind.
Observing the world in this context includes a lot of different ways of thinking about research and hypotheses. For starters, there is the method of simple, firsthand observation in your own life. Look around at work. Do you notice certain things that may be useful to study through scientific research? Suppose your workplace offers one long break during the day. But perhaps you think that staff would work better with a series of short breaks divided throughout the day. This is an empirical question; one that could be assessed with the scientific method. In this example, you may find that observing your own workplace may be a great way to inform your research ideas for this course in labor and human resources research.
Another great source for research ideas is your old course work. If you took a class in something that was of particular interest to you, perhaps you can dig into a specific aspect of that course for your own scientific study. Maybe there was a nagging question in one of your courses, one that had you scratching your head and saying, yeah, but what if...? This question can be a great source for you to find your own new and unique research topic. In this same vein, sometimes just reading your old textbooks, notes, and other materials may be a good way to come up with a research topic. With the University Libraries and their resources, you can try to find books about the topic that may give you a good, broad introduction. In the field of science, we also have scientific journals that can be excellent resources for your research. These journals are peer-reviewed, which means that someone did a study of some kind and then submitted it to the publication. This publication then found peers of the author—other people in the field—and asked them if they thought the article was good enough to publish. In this way, each journal sets a standard for publication; the work that makes it to the press has at least been through some level of informed review. These journal articles are often very specific, which can be both a blessing and a curse. If you don't have a lot of background in the topic, a journal article may be difficult to understand. But if you do have enough understanding in the topic, these articles can provide a direct resource toward understanding the phenomena of interest.
Another great way to come up with research topics is by simply talking to people. Yes, this is a step that can be done over a cup of coffee, over lunch, or in a more formal meeting. Your coworkers, family members, friends, mentors, and professors can be a great place to start for talking about research ideas. Suppose you have a very rough idea of what you want to study, and you sit down with a coworker and describe it to them. They may say that this makes them think of something slightly more specific, which may then remind you of something you learned in a prior course. You would be amazed at how quickly these topics can form and develop when you have someone to bounce ideas off of!

Rather than starting from scratch with a brand new question and method, sometimes you can look at work that other researchers have done and then extend or change that work in your own research. Perhaps the original study only examined members of the white-collar workforce. In this case, you could do the same study but with a blue-collar workforce. Perhaps a prior study examined productivity in terms of profits, but you think that productivity would be better measured by the amount of actual work achieved. Additionally, new technology can permit a more complete view of behavior. For example, with the advent of social networking websites, it may be possible to document social behavior in a way previously not possible.
Isaac Newton once said, "If I have seen further, it is by standing on the shoulders of giants" (Newton & Hooke, 1675). What he meant by this statement is that he was able to achieve much of what he did because he benefited from the discoveries and achievements of previous thinkers. You may benefit in this same way by reading prior research and studying the work of other scientists. Since you are Penn State students studying online, you may or may not be within a reasonable distance of a Penn State library. If you are fortunate enough to be near the libraries, I recommend looking in their online catalog for books related to your topic. Still, many college and university libraries or community libraries are more than adequate for your purposes, so go ahead and search for books about your topic.
On the other hand, as students of Penn State, you benefit from being able to access an enormous number of scholarly journals and publications online. We will have an exercise on how to do a search for these resources, but if you want to check some out now, go ahead and access the University Libraries web page through the Penn State website. When you find an article that you might want to read, it will often (if not always) be accompanied by a brief summary called an abstract. This concise summary will give you a rough idea of what the article is about, so you can decide if you want to read the actual article. In no way should the abstract be treated as a substitute for reading the article, but it is a useful tool to help decide which articles you actually want and need to read.
A very useful way to find articles is to find one article about your topic, and then look at the references section of that article. Each article will typically reference at least 10 other articles that are relevant; as such, you may be able to quickly find a large number of good articles for your topic. Additionally, most scholarly search engines allow you to see how many times that article has been cited by other researchers.
I'd like to revisit the idea of talking to professors and instructors about your research ideas. This can be a delicate matter, as professors and instructors can be extremely busy people. Professors also make their living by being really good at thinking about and coming up with ideas. So when you go to bounce ideas off of them or to seek assistance in developing your own ideas, you're essentially asking them to do for free what they should be getting paid to do. As such, it is extremely important that you not expect professors to do all of your thinking for you. You should do a lot of reading and thinking about your research ideas before you meet with a professor or instructor; when you do meet, you'll only need to discuss how to refine or perfect your ideas rather than to brainstorm or get new ideas.
You likely won't have these same anxieties over meeting with fellow students or friends about your research ideas. Feel free to brainstorm with friends and peers as long as they are willing to do so. You may find that this experience is both rewarding and enjoyable. One extremely useful thing about discussing research and research ideas with your peers is the simplification of your language and ideas. When you talk to a professor or colleague about your work, you may be tempted to use bigger words and ideas than you would use when talking to someone who doesn't know about your field. If you can describe your ideas in simple language to someone who doesn't know about it, you can be pretty certain that you yourself actually understand that idea pretty well.
References
Newton, I., & Hooke, R. (1675, February 5). Letter from Sir Isaac Newton to Robert Hooke. [Correspondence]. Simon Gratz Collection (Electronic resource). HSP Discover. Retrieved from https://discover.hsp.org/Record/dc-9792/Description#tabnav
Formalizing Ideas Into Hypotheses
A brief discussion of what scientific ideas are and how they are organized is in order at this point, as we will begin discussing how to turn research questions into actual hypotheses. When it comes to scientific ideas, there is a hierarchy of laws, theories, and hypotheses. These categories are not the sort of thing that come from a central authority, and there can be a great deal of overlap between them. But they generally come from common use. That is, if a scientific principle is so general and universal that it can be said to hold in all (or nearly all) situations, we generally call it a law. Scientific laws are few and far between, but good examples are the Newtonian laws of motion. The next step down in the hierarchy is a theory, which is a principle that is supported by a good deal of data, but it is not yet so universal that it can be said to hold in all situations. Finally, the hypothesis is a proposed principle or set of principles that may have some support, but it hasn't yet found enough support to be called a theory. Again, these categories are somewhat nebulous, but they can be a useful way to talk about scientific principles. For example, if you were to find a type of motion that violated a Newtonian law of motion, that would indicate either that you had a major scientific finding or flawed data.
When we think about scientific principles, whether they be laws, theories, or hypotheses, we must always consider two fundamental concepts: generality and parsimony. Generality refers to the range of phenomena that can be described by the principle, while parsimony refers to the simplicity of the principle. You may have heard someone say that the simplest explanation is the most likely one. This idea is based on William of Ockham's idea that “entities are not to be multiplied beyond necessity" (Duignan, n.d.). This concept, known commonly as Occam's razor, is saying that simple explanations are generally better than more complex ones. Often, the formulation of a scientific principle requires a tradeoff between this preference for simplicity, or parsimony, and generality. We often must make a choice between a principle that describes a great deal of behavior but is very complex, or a principle that is simpler but does not describe as much. To a great extent, the practice of statistics is built upon this very principle, but we'll get into that later in the course.
One of the most critical aspects of a scientific principle is that it must be testable, or even falsifiable. The term that describes a statement that is by its nature impossible to disprove is referred to as a tautology, or a tautological statement. If you were to state that the reason why objects in motion tend to stay in motion (Newton's law of inertia) is because an almighty deity makes it happen, this is a problematic statement for scientific inquiry. This is not to say that this is untrue, but in order to investigate whether that statement is true, you would need to be able to measure that almighty deity. This is, of course, impossible. When you formulate a hypothesis or question, you must be careful to only develop ideas that are falsifiable.
References
Duignan, B. (n.d.). Occam's razor. In Encyclopaedia Britannica. Retrieved from https://www.britannica.com/topic/Occams-razor
Types of Variables
This brief discussion is largely about terminology, but the reasons for this discussion are deeper than just defining various things. Remember that experimental research refers to research in which one or more variables are changed or manipulated by the experimenter. You might even say that this variable (or these variables) are independent of other variables—they are changed independently of any other variables. For this reason, this manipulated variable is called the independent variable (IV). The variable (or variables) measured by the experimenter may or may not change as a function of what happens with the IV. In this case, you might say that this measured variable is dependent on what the manipulated variable is. For this reason, we call this variable the dependent variable (DV).
Now if you remember correlational research, this is the type of research in which two variables are measured, and the relationship between them is investigated. The important distinction here is that neither of these two variables are manipulated or changed by the experimenter. Rather, both are merely measured. For example, if we were looking to determine whether a happy worker is a more busy worker, we would measure each worker's job satisfaction and job performance and see whether there was a tendency for one to increase while the other also increases. In this example, we are attempting to predict with one variable (job satisfaction) what the outcome of the other variable (job performance) will be. For this reason, one variable is labeled the predictor variable and the other is labeled the outcome variable. Both of these variables are measured in each and every participant in the study, and the relationship between the two is assessed using statistical analysis.
Some Other Thoughts on Scientific Thinking
The type of thinking that we do in science is in many respects different from that used in other areas of academics and society. Scientific thinking follows a deceptively simple, intuitive, and yet somehow very difficult general line of reasoning often referred to as hypothetico deducto. Simply put, this principle states that we make a hypothesis, and if that hypothesis is true, the data should follow in a certain way. Meaning, if that {hypothesis} is true, then our results should be {data}. Of course, this seems a rather obvious point, but it never ceases to amaze me how often people reverse this principle and instead say these {data} mean that {hypothesis} is true. At face value, these two statements seem to be interchangeable:

However, they are not equivocal. Take for example the statement that, "Consumer spending increased this quarter, as did the gross domestic product; therefore, the growth of the U.S. economy is due to consumer spending." Certainly, this statement may be true, but the reasoning is not sound. The gross domestic product and consumer spending could as easily have both increased because of a government stimulus that gave a bunch of free cash to everyone in the country. Or the two things could have increased for no common reason at all. We could propose any number of alternate hypotheses to explain the data. If instead we say, "If economic growth is due to consumer spending, then we should see consumer spending and GDP increase at the same time," we can better rule out alternatives in future studies. We could then ask whether GDP increases with government spending, or we could ask whether consumer spending increases with global temperature, or any number of other alternatives.
Chapter 4: Numerical Description of Behavior
Basics of Measurement
The whole idea of measurement is taking some idea and putting a number to it. A concept is just a concept, just an idea, but when you decide to somehow apply numbers to that concept, it becomes a new, different thing. Of course, you might arbitrarily put numbers to any number of concepts, and while those would then become measured things, technically, the quality of that measurement is somewhat in question.
At this point in your education, you should have some idea of what a variable is, at least in the very basic sense that it is a symbolic representation of a changeable value in an equation. For our purposes, we're going to think about variables in a very broad sense. There are conceptual variables, which refer to the idea that you want to get at, and then there are measured variables, which actually put numbers to that idea. This distinction may seem unimportant, but if you think about how things actually work in the world, people think about things in terms of concepts and relationships between those concepts. When it comes time to actually investigate or use these relationships, then we turn to measurements. But the rules of the world are generally described in terms of concepts. For an example, think about the relationship between how happy a busy worker is with their job and how well they do at their job. We don't describe this relationship as "an employee who rates their job satisfaction as high on a scale from 1 to 10 generally ships more units or creates more profit for the company." No, we just say that greater job satisfaction leads to better job performance.
The first version of this relationship, "an employee who rates their job satisfaction," describes the relationship in terms of measured variables, while the second version describes it in terms of conceptual variables.
So if we think about things in terms of conceptual variables, what's the point of even having measured variables? Well, in order to uncover the relationships between conceptual variables, and in order to use those relationships, we have to have some way of measuring them or turning them into numbers. This is what sets scientists apart from philosophers and any number of other types of scholars. We use math as another language through which to understand the world. Our numbers and statistics are what set us apart from other fields, not any fancy devices. As such, we have to come up with a rigorous method of creating measured variables. For this purpose, we have operational definitions to turn conceptual variables into measured variables.
For example, if we wanted to look at the concept of intelligence, we could operationally define intelligence as a score on an IQ test. We could define strength as the maximum amount a person can bench press. For job performance, we could look at an individual's productivity, their number of sales, the number of sick days taken, or any number of other alternatives. Here is the problem: any given conceptual variable can typically be operationally defined in a large number of different ways. Similarly, the same measurement can often tap into a number of different concepts. This is usually one of the biggest hurdles in research—just coming up with the right operational definition.
Types of Variables: Measurement Scales
A useful way to think about variables is in terms of measurement scales, which refer to the degree of granularity or resolution that the variable has. Think of it as what the variable allows you to do with it in terms of mathematical operations.
Nominal scales name or identify a particular characteristic about something. A good way to remember this is that nominal begins with n, as does name. For our purposes, think about nominal scales as a particular characteristic of an individual, such as race, gender, religion, or other demographic variables. When we do analyses with these labels, we may give them numbers as shorthand, but they are categories—not numbers in the usual sense. Hence, we sometimes call them categorical variables.
Ordinal scales rank order things along a continuum, or give the order in which the scores line up based on some dimension. A good way to remember this scale is that ordinal begins with ord, as does order. Examples of ordinal scales include class rank or football rankings. You know from football rankings that one team is higher than the other, but it is not necessarily the case that the difference between team 1 and team 2 is the same as the difference between team 2 and team 3. All you know is that team 1 is better than 2, and team 2 is better than 3. Ordinal scales do allow for more precision and resolution than nominal scales; instead of just knowing identity or category, you have some idea of which scores are greater than others.
The interval scale provides both the rank order and relative distance along a single continuum. Unlike an ordinal scale, on an interval scale, the difference between 1 and 2 is the same as the difference between 2 and 3. Interval scales do not necessarily give you a meaningful zero value though, as zero may be some relatively arbitrary point. Think of it as being like Celsius temperature measurement. On the Celsius scale, zero degrees does not mean that you have zero heat.
The final type of scale to be discussed here is the ratio scale, which provides rank order and relative distance, as well as a zero point (none of whatever the scale is attempting to measure). In contrast to the Celsius scale, a zero on the Kelvin temperature scale means that you have zero heat. Also, think about measuring mass. If you have zero grams of something, it means that you truly have none of it whatsoever.
As a quick summary, think about scales in terms of what they tell you:

Types of Measurements in the Behavioral Sciences
We'll move on now to talk about the types of measurements that we use in the behavioral sciences. The first major type of measurement is a self-report measure, which means that you ask the participants to report their own assessment of the variable you're attempting to measure. There are two main types here: the fixed-format response and the free-format response. In a free-format response, the participant provides any thoughts or feelings that they have about a given question. These responses give you a great deal of data, with rich amounts of detail and a lot of information. But you can imagine that if you asked a free-format question of 100 different people, and each answered it in a slightly different way, it would be quite difficult to do any kind of numerical analysis of their responses. You would have to find some way to code all of these responses into the same numeric scale. Say that you had a free-format question to ask participants to say what they see when shown an inkblot (much like the Rorschach test). Of course, you could get a great deal of information from the participants, but how would you do any kind of statistical analysis on such responses?
Fixed-format responses, on the other hand, ask participants to choose from a set of alternatives when giving feedback, much like a multiple-choice test. You don't get as much detail from a fixed-format response, but it is much easier to code into numbers for analysis. A common way of asking fixed-format responses is to use what is called a Likert scale. Likert scales ask a participant something similar to, "On a scale from 1 to 7, 1 being strongly disagree and 7 being strongly agree, rate your agreement with each statement." Likert scales may have any number of response choices, but you need to consider a couple of major things when deciding how many to offer to participants. If you have too many choices, participants may become confused. But if there are too few, you may not get as nuanced a view of what participants are thinking. Another consideration is whether you want to have a middle point (such as 4 on a 1-to-7 scale). People like to have the option of a neutral response, but neutral responses don't really tell you much about the participants' thoughts and behaviors. If you give the option of a neutral response, people will choose it a good deal of the time, generally speaking. One more thing to consider about fixed-format response types is the notion of acquiescent responding, or the possible tendency for participants to simply agree with every question. For this reason, it helps to write half of your questions in one direction of agreement, and the other half in the opposite direction. For example, if you were asking about job satisfaction, for half of the questions, a "strongly agree" response would indicate high job satisfaction; while for the other half of the questions, a "strongly agree" response would indicate low job satisfaction. At the very least, this format ensures that your data won't come out completely neutral or skewed because of acquiescent responders.
Another type of fixed-format responses is the semantic differential, which puts two extremes at either end of a line, and participants are asked to put a dot or a marker on the line to indicate what they think. See the following example:
How do you feel about Bill and Ted's journey?
Bogus ------X-------------------------------------------------------------------- Excellent
How do you feel about Bill and Ted's adventure?
Bogus----------------------------------------------------------------------X-------Excellent
When people know they're being assessed and measured, they may behave differently; as such, any time you ask people about their feelings and thoughts in a behavioral science context, you run the risk of getting answers that are not entirely honest or truthful. Participants may want to make themselves seem like better people than they truly are, or they may want to simply mess with your data. These are examples of reactivity, or participants responding differently because they know they are being studied. A great example of reactivity is the Hawthorne effect. Social desirability, on the other hand, is a special case of reactivity in which people want to seem like good people; they will give answers that don't necessarily reflect what they actually believe.
Behavioral Measures
One way of avoiding the problems associated with self-report measures is to use what is called a behavioral measure. This type of measure is one in which you actually measure something about the participant's actual behavior in response to a variety of different stimuli. Suppose you have a hypothesis about how much eye contact employees make with their bosses and the subsequent achievement of those employees. You could measure a variety of different things:
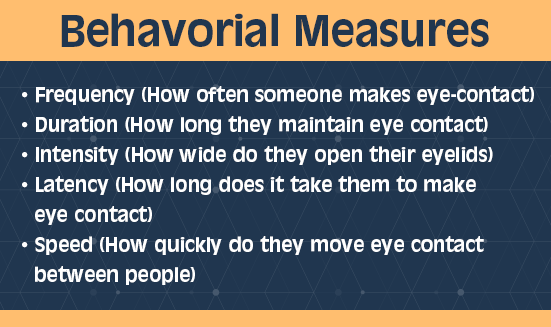
These main categories of behavioral measures can be applied to any number of different behaviors. But again, the difficulty is choosing which is the best measure for your specific research question and hypothesis.
Psychophysiological measures are another type of behavioral measure that allow us to look at the participant's physiology in response to different stimuli. If you want to know some specifics about psychophysiology, take a look at this psychophysiology Wikipedia page. In short, psychophysiological measures use electrical and mechanical devices to transform the participant's heart rate, respiration, and even brain activity into numerical signals that can then be analyzed. These techniques are challenging, complicated, and sometimes rather ambiguous in terms of what they tell us; a number of researchers have devoted their entire careers to developing these methods. While we can learn interesting things about behavior from psychophysiological measures, you must be cautious when jumping into this realm of study, as it can be quite complicated.
Choosing the right measure for your research question can be quite tricky, but the best guide for you can often be prior research. If you're investigating job satisfaction, and you want to know what's the best way to measure it, look into how other people have investigated job satisfaction. Often, there are a lot of very clever and educated people studying the same thing you want to study, and they have found the best way to measure that thing through extensive investigation. This is an area where you can truly stand on the shoulders of giants, and perhaps you may see farther than others because of it.
![]()
EPA 3

INSTRUCTOR: Welcome to Enrichment Presentation Activity 3. In this lesson, we take a look at something called the hypothesis.
By definition, a research hypothesis is a specific and verifiable prediction regarding the relationship between or among two or more variables. Another way to look at it, it is a proposal that is to be tested and evaluated.
The hypothesis statement asserts that a relationship exists, and it also states the direction of that relationship. In other words, you as a researcher believe that one or more things are causing something else. For example, giving people a raise makes them happy. Or playing music while taking a test causes distraction. And so you make this into a prediction that you're going to explore with your research.
Where does the hypothesis come from? It can be an area of interest or a topic that you want to know more about. It can be an observation that you have made and want to investigate further. You start broadly and make it specific to a situation. Is this about all people or does this only happen in certain situations or under certain conditions?
We don't prove or disprove our hypothesis. Rather, we seek to find evidence to support our claim or proposal. When enough research is done that finds support, we accept our hypothesis as basically being true.
This is where it gets a little confusing. We start by pretending that our prediction is not true. So we might say that giving people a raise has no effect on happiness. When we do this we call this no-change statement the null hypothesis. The null means that there will be no change between the mean or average measurement of the first group pre-change and the mean of the second group post-change. Remember we are studying a group of people, so we look at the average measurement.
We then write up the opposite. There is a change, and we call it the alternative hypothesis. We are predicting that there will be a change in the means due to a manipulation we propose. Our manipulation in this example is that we are increasing salaries. If there is a measurable change as a result of our study, we will reject the null statement, which said that there was no change, and accept the alternative hypothesis. And we have a research result to share with whomever may be interested.
Here's an example of hypothesis statements. A null hypothesis statement might be that there will be no difference or change in productivity between workers who work day shift and those who work night shift. One alternative hypothesis may state there will be a decrease in productivity in night shift workers as compared to day shift workers. Maybe because we believe they goof off more at night.
Or another prediction might be that night shift workers are more productive than day shift workers, and that might be because there aren't as many distractions at night. Again, if you find a measurable change once you conduct your experiment-- in this case, monitoring production-- then you reject the null statement. And that means that you will accept your hypothesis statement. Remember, the hypothesis is your prediction about the effect of your manipulation.
For your assignment this week, write an observation about something. It can be something work- or school-related, or it could be something very simple, such as, the sky seems very blue today and it rained last night. Then, make a prediction out of your observation. For example, I might say that I believe the sky is bluer after a night of rain. Then write this in the form of null and alternative hypothesis statements.
Finally, what does it mean to reject the null hypothesis? Explain that.
If you have any questions, please let us know.

EPA 4
INSTRUCTOR: Welcome to Enrichment Presentation Number 4. In this presentation we're going to take a look at variables, because variables are the units that we study through measurement.
A variable is any attribute that can assume different values. Variables can be simple, such as height, weight, sales, or color. Or they can be more complex, such as health, intelligence or leadership. Variables can be classified as independent or dependent.
Independent variables can be further defined as either a treatment or a classification variable. A treatment variable is a variable that is controlled or manipulated by the experimenter or researcher.
Let's say I'm interested in how wall color affects mood. Wall color is the treatment variable that I will manipulate by placing people in rooms with three different colors. A classification variable, on the other hand, is some characteristic that was present prior to the study. So it's something that I'm going to gather data on.
Let's say that I'm interested in sales among retail stores. So I decide to compare four different geographic regions. The geographic region, then, is a classification variable.
Independent variables can be broken down further into levels or conditions. In the wall color study, the four colors that I use-- pink, white, and blue-- are considered the levels or conditions. In the study of retail sales, I can break down the geographic regions into large, medium, and small stores. Or I could choose inner city, suburbs, and small towns.
A dependent variable is the response to the independent variable. It is the measurement of the variable under study. Or, in other words, it is the thing that I'm studying, that I'm interested in. It may or may not change as a result of our manipulation, and this is what our data will tell us. In my wall color mood example, mood, then, is the dependent variable. In my retail example, sales is the dependent variable.
At times variables aren't straightforward and easily defined, like color or sales. Variables that could be considered complex include things like beauty, fear, intelligence, and even productivity. Because they have some subjectivity, they require us to define them further by providing what we term an operational definition. In other words, change them into something that is more easily measured. So for each complex variable that I study, I need to operationalize it.
An operational definition is a means for indirectly measuring and defining a variable. It specifies a defined procedure for measuring an external recordable behavior or event and uses these measurements as a hypothetical construct. In other words, I look at some behavior, and I use that to define the variable under study.
For example, I use an IQ test to measure intelligence. I might use heart rate or heart rate plus some behavior, such as running away, to measure fear. I might use a survey to measure happiness. The responses given on the survey, the heart rate, the answers given in the IQ test are observable and recordable and are understood and accepted as measures of the variables.
We can further classify variables by how they are measured. A nominal variable is used to name something or identify a characteristic. They're qualitative rather than quantitative. Examples might be geographic region, a political affiliation, gender, or even college major. We label these things and give them a name. So that's a hint on how to remember it. Nominal are names.
In ordinal measurements, these are measurements that are ranked sequentially and given an assigned meaning, such as low performing versus high performing, or small, medium, large. It's a name that has a bit more meaning to it.
An interval measure means that there are equal distances between the measures. Examples can include inches on a ruler, degrees of temperature, or minutes on a clock. A ratio measurement is similar to interval but includes a zero, and we can multiply and divide numbers on a ratio scale-- height, weight, temperature. So something can be twice as tall, twice as heavy, or twice as hot. That can't be done without a zero reference.
So what scale should we use for our study? Well, nominal scales can only tell us that a difference exists. Something can be pink, blue, or green. It's different. An ordinal scale can tell us the direction of the difference. Something is larger versus smaller or high versus low. But with an interval scale, we can determine the direction and magnitude of the difference.
However, a ratio scale allows us to determine direction, magnitude, and the ratio of the difference. For example, a 1% increase in exercise could lead to a 2% decrease in heart disease.
For this week's assignment, describe a simple experiment that includes an independent and a dependent variable. This can be anything-- work-related, school-related, something from home, something from nature. Describe where you will manipulate an independent variable and you hope to see a change in a dependent variable.
Then describe a complex variable and explain how you would operationalize it. Maybe you use leadership or productivity or intelligence. Provide a paragraph for each, and let us know if you have any questions.