Main Content
Lesson 5: Project Budgeting
5.5.2 Tracking Chart*
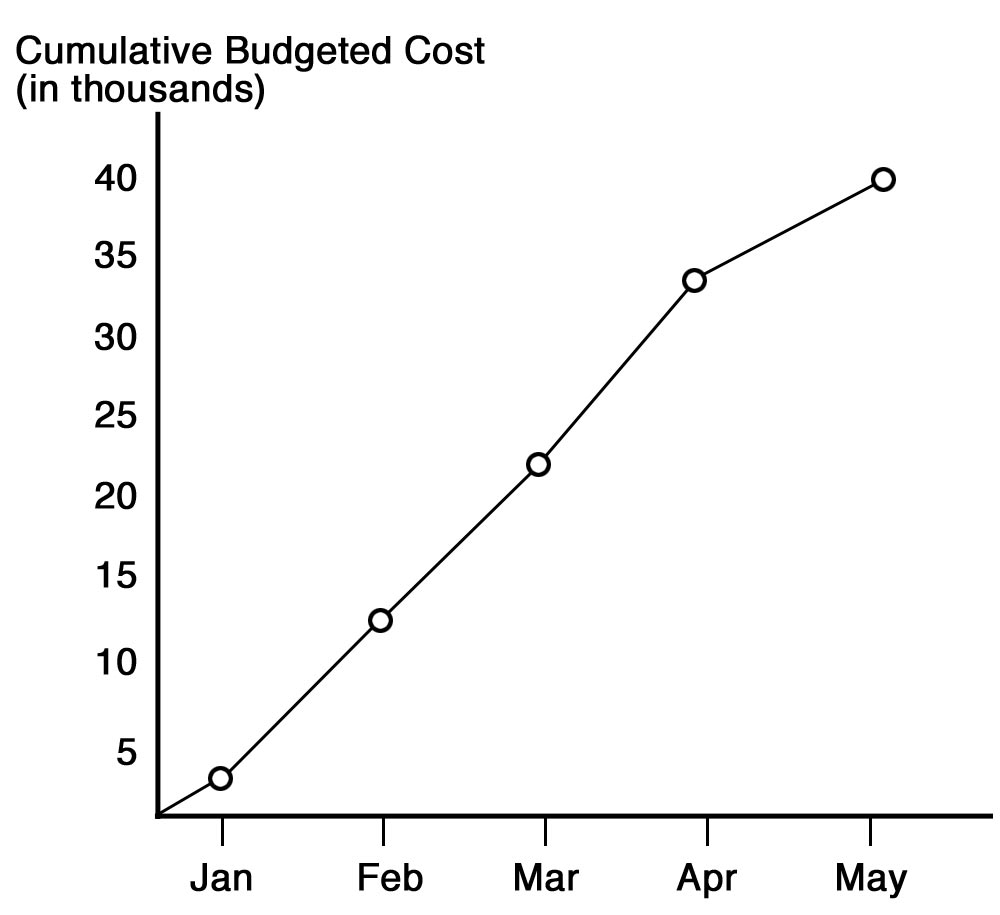
Visually, we can produce a tracking chart that illustrates the expected budget expenditures for this project by plotting the cumulative budgeted cost of the project against the baseline schedule. Figure 4.1 shows a simplified example of the plot and is another method for identifying the project baseline for schedule and budget over the anticipated life of the project.

Figure 5.2 Cumulative Budgeted Cost of the Project
Source: Pinto, forthcoming. Used with Permission
