Main Content
Lesson 1d: Fixed versus Variable Cost
Fixed vs. Variable Costs: Overview
The formula for a straight line comes from your math courses earlier in life and is used in your college statistics course when covering linear regression. This would be a great time to use Google to revisit the Cartesian plane. At the time this was prepared, one good place to go is "Line (geometry)" in Wikipedia.
The formula for a straight line utilizes the northeast quadrant of that Cartesian plane.
The formula is Y = a + bX, where
- Y = the dependent variable, because its value depends on the value of the other variables in the equation. When graphing, the vertical axis is the Y-axis. In accounting, Y is usually monetary, representing either revenue or cost. Most often, in cost or managerial accounting, Y will be a cost.
- X = the independent variable, because it comes from outside the equation, meaning its value does not depend on any other values in the equation. X is a measure of activity. When graphing, the horizontal axis is the X-axis. In accounting, X is usually units sold where Y is revenue or units produced where Y is cost. However, X could be something else, such as miles driven, where Y is automobile operating cost. Most often, in cost or managerial accounting, X will be units produced.
- a = the intercept. It is the value of Y when X is zero. In accounting, it is the fixed cost portion of the equation.
- b = the slope, defined as rise divided by run or the change in Y over the change in X. It is the rate of change in Y as X changes. In accounting, it is the variable cost portion of the equation.
An overview of fixed, variable, mixed, and step cost is presented here. Examples are presented and discussed on the slides that follow.
A fixed cost is a cost that remains unchanged in total when activity changes. In terms of the equation Y = a + bX, it is the value of Y when X = zero, which is Y = a. The example we will cover shortly is straight-line depreciation on a factory building.
A variable cost is a cost that changes in total proportionally (linearly) as activity changes. In terms of the equation Y = a + bX, it is the value of Y when a = zero, which is Y = bX. The example we will cover shortly is direct material used in a product.
A mixed cost is a cost that is partially fixed and partially variable. In terms of the equation, it is the value of Y when both a and b exist, which is Y = a + bX. The example we will cover shortly is factory utilities. To use Excel to separate a mixed cost, see the article "Forecasting with Excel: Regression Analysis Can Help Predict Revenues and Costs" by James A. Weisel, Journal of Accountancy, February 2009, pp. 62–67.
A step cost (also known as step-variable or step-fixed) is a cost that varies in batches as activity changes. It does not fit into the equation presented, because it is not linear. The example we will cover shortly is salary for factory supervisors.
Fixed Cost
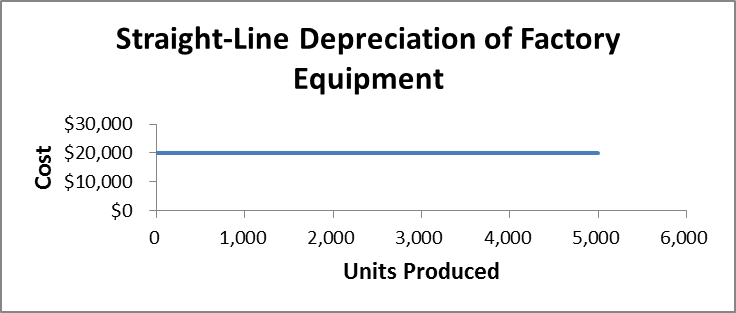
The graph in Figure 1.4 shows that straight-line deprecation of a factory building displays a fixed cost. The plant depreciation will remain at $20,000 during the next year regardless of the level of units produced. In terms of the equation for a straight line, Y = a = $20,000.

Variable Cost
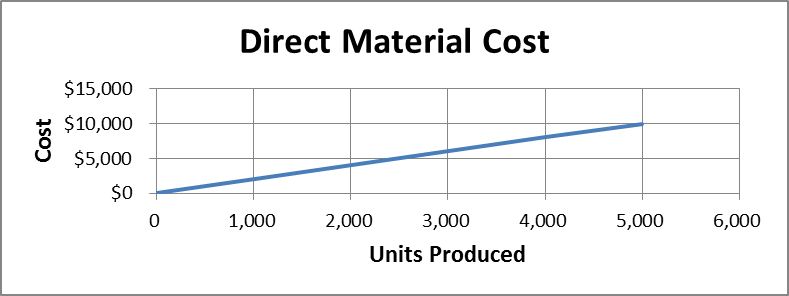
The graph in Figure 1.5 shows that direct-material cost displays a variable cost. The direct-material cost changes proportionally with any change in the units produced. To change proportionally, the cost has to be linear, meaning it has to plot as a straight line. In terms of the equation for a straight line, Y = bX = $2X.

The variable cost is the slope of the blue line that is going up the graph, assuming you are looking at a color version of the graph. Slope is rise over run, and this comes from mathematics, not from accounting. We're simply using mathematics to do this plot. Note that the cost rises from $0 to $10,000 as the activity runs from 0 to 5,000 units. Rise over run is or $2 of cost rise for every 1 unit produced.
