Main Content
Lesson 1d: Fixed versus Variable Cost
Fixed vs. Variable Costs: Mixed and Step Costs
Mixed Costs
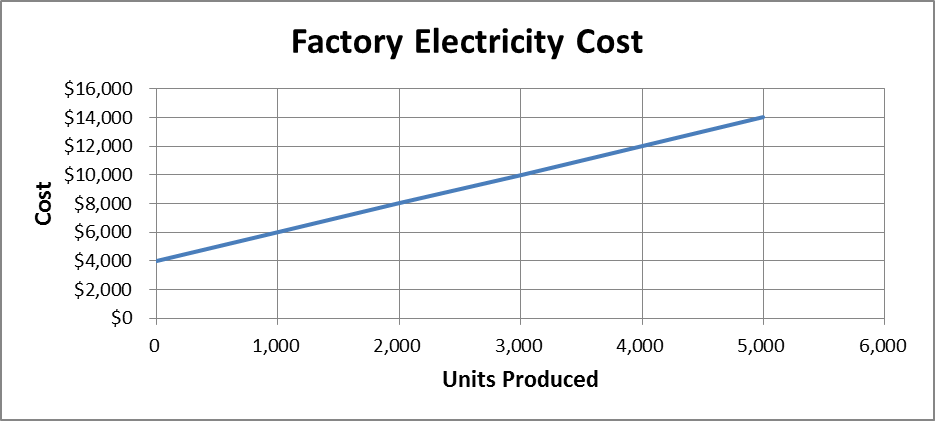
This graph of factory electricity shown in Figure 1.6 displays a mixed cost—a cost that is partially fixed and partially variable. The factory electricity costs $4,000 even when there is no activity. This might be the cost of heating and cooling the building and having the lights on, independent of production. In addition, the cost changes proportionally with any change in the units produced, which is the activity level. An additional $2 in electricity is used each time a unit is produced. In terms of the equation for a straight line, Y = a + bX = $4,000 + $2X.

You can easily divide a mixed cost into its fixed and variable components. For example, if you were doing a budget, and you wanted to divide this factory electricity into fixed and variable, you would say, "Fixed factory electricity is $4,000 and variable factory electricity is $2X or 2 times the number of units produced." Once you have the formula for the mixed cost, it is easy to divide it into fixed and variable.
The hard part with the mixed cost is getting that formula. The utility company does not send you a bill saying, "You owe $9,500. $4,000 was fixed and $5,500 was variable." No, it sends you a bill simply saying, "You owe $9,500." You have to figure out how much is fixed and how much is variable. The good news is that it's easy to do that using the regression function within Excel. That is, you could take your last 12 utility bills and throw in the amount you paid for utilities (the Y values) and your volume of output (the X values). And Excel will estimate the a and b values for Y = a + bX.
You may not remember this from your statistics, but the problem is that if you only have only 12 data points, your estimates of a and b don't tend to be stable. Statisticians would tell you that you need about 60 data points. To get 60 data points, you would need 5 years of monthly electric bills. The problem with long periods of time is that the data may not be stable. That is, your electric rates may have changed during the last five years, so you're comparing apples and oranges, and that doesn't work well. As long as you realize you're probably going to end up using the last 12 months of electric bills to get values for a and b that are not perfect, and you can live with that imperfection, that's probably the way to go.
Step Costs
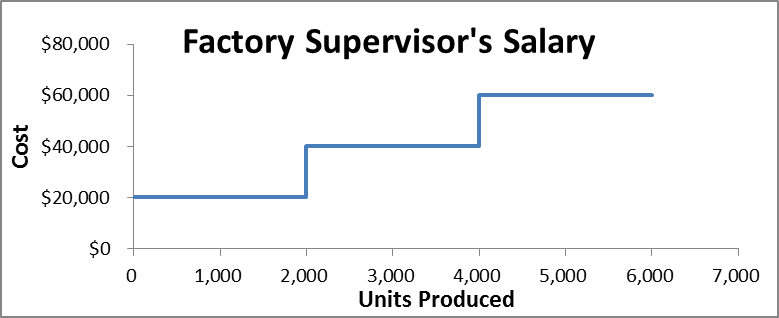
A step cost is a cost that increases after a batch of units. In this case, consider the example of factory supervisor salary (see Figure 1.7).

Let's assume one supervisor can supervise up to 10 workers. Supervisors cost $20,000 per year each. (I know this is a ridiculously low number.) Let's also assume that one worker can make 200 units per day.
If the company is going to make between 1 and 2,000 units, it is going to need between 1 and 10 employees. At this level, it is going to need one supervisor at a cost of $20,000. So, the line starts at $20,000 and goes out until it hits 2,000 units.
Once the company exceeds 2,000 units, it will need to hire more employees and, therefore, more supervisors. From 2001 to 4,000 units will require 11 to 20 employees and two supervisors at a total cost of $40,000. From 4001 to 6,000 units will require 21 to 30 employees and three supervisors at a total cost of $60,000.
The stair-step look of the graph is what gives this cost its name.
Now, what can you do with that step cost? There are a couple of ways to handle it, but any way you handle it, you have to break it down into fixed or variable cost. We will cover two ways.
One way, the simple way, to handle it is to have a relevant range that is on a single step. So, if production is expected to be between 4,000 and 6,000 units, then the organization needs three supervisors at a fixed cost of $60,000.
Often, a step cost cannot be converted into a fixed cost, because the relevant range cannot be restricted to one step. So, a second way to handle it is to draw a line starting at the minimum of $20,000 for one supervisor through the center of the remaining steps, and then use the slope of that line as the variable cost. What you end up doing is turning the step cost into a mixed cost. In this case, you only get the correct cost at the midpoint of each step. Below the midpoint of the step, you underestimate the cost and above the midpoint of the step you overestimate the cost.
