Main Content
Lesson 1: Overview of the Food System
The Marketing Bill and Farmers’ Share of Food Expenditures
We have looked at the functions that markets perform in the food system and that value is added to agricultural commodities as they are transformed and moved through the food system to consumers.
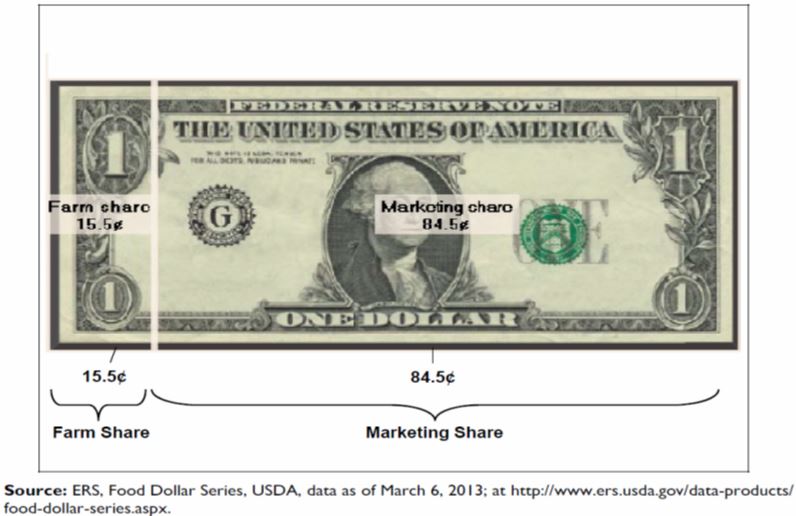
On average, the US farmer receives 15.5 cents of the sales value of food products consumed in the United States. The marketing functions that we talked about earlier take up 84.5 cents of each dollar that US consumers spend on food.

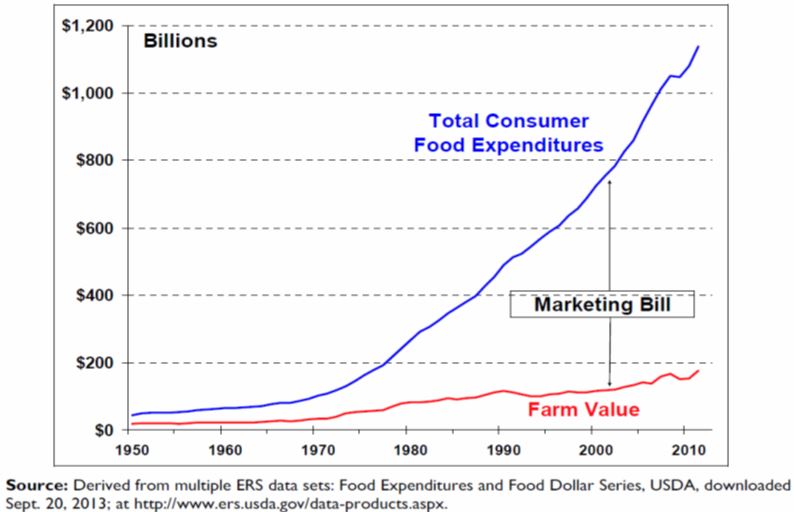
The marketing bill – the cost of all the functions beyond the farm gate - has increased more rapidly than the farm value of agricultural commodities. In 2011 the farm value of food was around 177 billion dollars, but 963 billion dollars was involved in transforming raw agricultural commodities into food products and delivering them to U.S. consumers through retail stores, restaurants, and other consumer outlets.

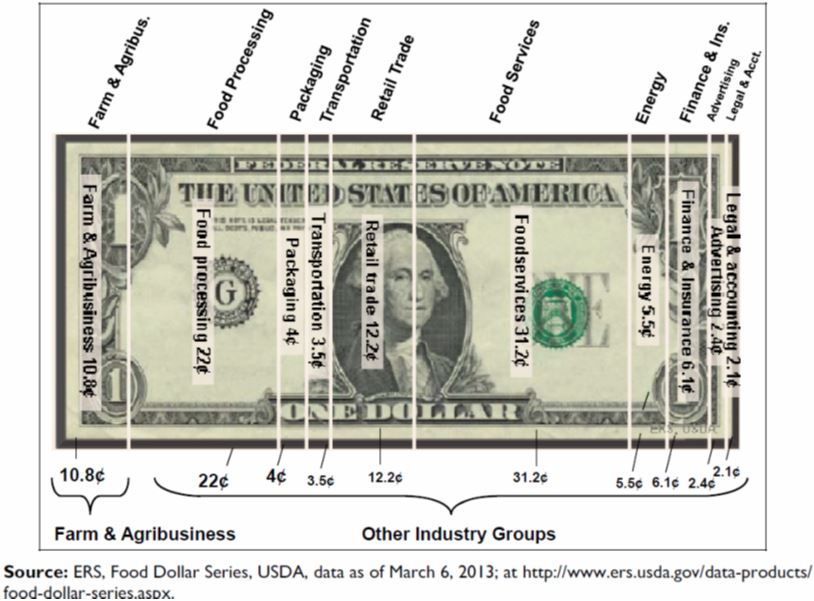
One way to break down the consumer dollar is by industry group, e.g., farms and agribusinesses, food processing, retailing and food service. The picture shows that the largest share of the consumer cost of food is generated by processing, and by distribution (retail trade and food service). These collectively accounted for over 65 cents of each dollar spent on food by consumers. The balance was made up by other functions such as transportation, packaging and energy use, and by other components such as advertising, finance and insurance and legal services. The farm and agribusiness value in this breakdown is less than the farm value in the earlier chart, since farms and agribusinesses must pay some of these additional costs (e.g., for energy and financing) in producing agricultural products.

Does the large share of the dollar taken by industries beyond the farm gate mean that these industries are making high profits? We do not have an estimate for 2011, but in 2006 the profits of businesses beyond the farm gate (processing, distribution, retailing and food service) were estimated to account for roughly 4.5 cents of the consumer’s food dollar. That does not seem to be an excessively large share. In fact, processing and marketing food can be a very low margin activity. The average supermarket makes around 1 cent in profit on every dollar’s worth of product that it sells. Pre-tax profit margins for full service restaurants are around 2 cents per dollar of sales. We shall look at these parts of the food system and what affects their profitability in lesson 7.
The share of consumer value that farmers receive differs substantially by product. It is high when relatively little processing is required. For example, the farm share of eggs (see table) is around 54 percent. In contrast, farmers receive a smaller share of the value of products that are highly processed. They obtain around 17 percent of the consumer value for processed fruit and vegetables and only 8 percent of the value of cereals and bakery products. We have already seen how that small share paid to farmers plays out in the case of bread.
| Food Groupa | 3-Year Averageb | Farm Share (%)c | Marketing-Bill Share (%)d |
|---|---|---|---|
| Eggs | 2010-2012 | 53.7 | 46.3 |
| Beef | 2010-2012 | 49.4 | 50.6 |
| Broilers (composite) | 2010-2012 | 42.5 | 57.5 |
| Pork | 2010-2012 | 31.4 | 68.6 |
| Fresh Fruit | 2009-2011 | 30.0 | 70.0 |
| Dairy | 2009-2011 | 29.4 | 70.6 |
| Fresh Vegetables | 2009-2011 | 27.6 | 72.4 |
| Fats & Oils | 2007-2009 | 24.0 | 76.0 |
| Processed Fruits & Vegetables | 2006-2008 | 17.0 | 83.0 |
| Cereals & Bakery Products | 2007-2009 | 8.3 | 91.7 |
| Total Market Basket | 2009-2011 | 15.2 | 84.8 |
Source: Derived from ERS data sets: Price Spreads from Farm to Consumer (http://www.ers.usda.gov/data-products/price-spreads-from-farm-to-consumer.aspx) and Meat Price Spreads (http://www.ers.usda.gov/data-products/meat-price-spreads.aspx), USDA, downloaded Sept. 23, 2013.
- Includes foods purchased for at-home consumption only. Farm values for fresh fruits and fresh vegetables are based on prices at first point of sale, and may include marketing charges such as grading and packing for some commodities.
- Most recent three-year period with available data.
- The value of the farm input contained in a retail food product, expressed as a share of the retail price.
- The difference between the retail food price and the farm share expressed as a share of the retail food dollar.
Where commodities are produced is key factor in determining how the food system functions. So it is to this issue that we now turn in the remainder of this lesson.
