
Welcome to Lesson 2 of COMM 310. In lesson 2, we will discuss how companies go about collecting data for decision making. In doing so, we will distinguish between variables and metrics and begin to discuss KPIs.
Measurement is at the heart of managing performance. Only by defining appropriate metrics and comparing them both over time and to the industry as a whole can you assess how well a business is doing. However, metrics are costly to track. Managers have to be judicious about selecting the appropriate metrics for the task at hand. This lesson discusses the qualities of a good metric; it should be
However, it is rare to find a metric that satisfies all these criteria. As in many other business situations, the goal of the digital media analyst is to balance multiple criteria, creating solutions that satisfy the requirements, without aiming for an ideal solution that may not exist.
Here are the objectives for this lesson:
By the end of this lesson, please complete the readings and activities listed in the Lesson 2 Course Schedule.
Please direct technical questions to the IT Service Desk.
There are many ways through which organizations collect data for decision making. While we will go through more advanced options later in the term, let us take a simple example in order to illustrate what data an organization might collect.
A mid-size bakery offers different options for their clients to purchase their goods. One option is to visit their traditional brick-and-mortar establishment in order to purchase items. A second option is to order online via their online ordering system. Below are three examples that this business may collect data to inform its decision making.
These are just three examples of how an organization may collect data. The first example includes operational data collect through daily operations. The second option provides data collected through the organization’s online retailer. Finally, the third option illustrates how an organization may use more formal research methods in order to collect information to drive decision making.
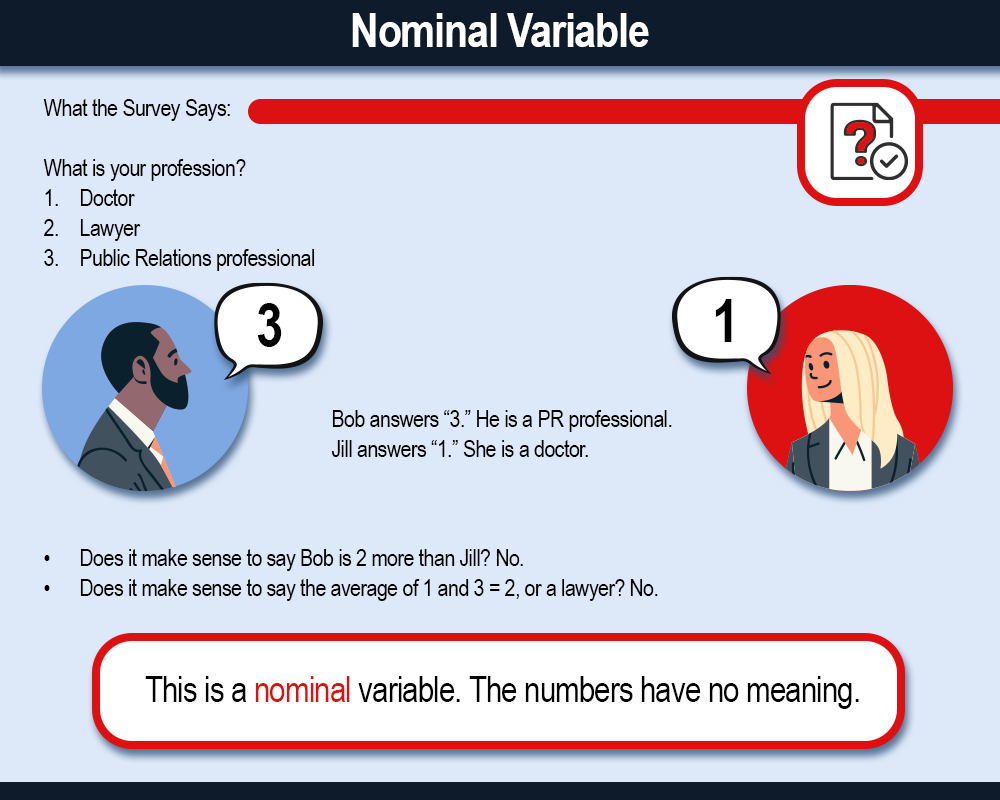
Every variable for which we collect data is associated with a level of measurement. Understanding what the level of measurement is will help you determine how to analyze the data you collect. The four categories of measurement are:
The first two levels of measurement (nominal and ordinal) are referred to categorical because the levels within those variables represent categories. The second two levels of measurement (interval and ratio) are referred to as continuous because there is equal mathematical distance between each level. We will explore this more later as we move through this lesson.
Example: Take for example the variable “Marital Status.” We can include several options or categories in this variable such as married, never married, divorced, etc. Below we have assigned numbers to the categories, but the numbers have no mathematical meaning. They just allow the researcher to analyze the data more systematically. There is also no ranking. Despite being assigned a larger number, being divorced is not higher or better than never being married.
How can we change this variable to be a dichotomous variable? We collapse categories, so there are only two. In this scenario, we have two simpler categories. The second category would capture everyone who is divorced, has never been married, or is widowed. See below:
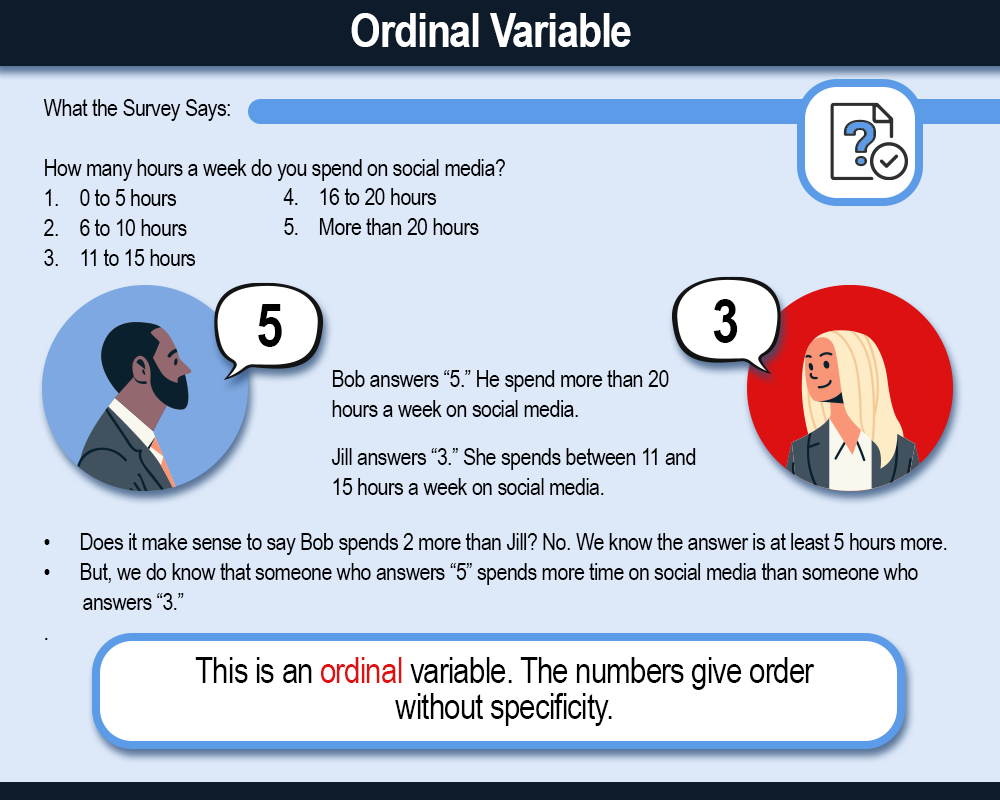
Like nominal variables, ordinal variables are also categorical because the levels within a variable represent categories. With ordinal variables, we can begin to sort categories into ascending or descending order. The key distinction between ordinal variables and interval variables (which we will discuss next) is that ordinal variables do not have equal distance between each of the variable’s levels or categories. Let’s go through an example below.
Level of education is traditionally the best example of an ordinal level variable. What level of education have you already completed?
As you can see, the levels or categories of this variable which we can refer to as “level of education” are sorted based on the number of years one would spend in order to complete that degree. For example, if you have a high school diploma, you may go on to complete a college degree. The categories of this variable are sorted, but there is not equal distance between each level. Sometimes, it takes individuals five or more years to complete a bachelors degree and masters degrees can be completed in various amounts of time based on the nature of the program.
Does anything stand out to you about this variable? Spend some time considering that question. You may be asked about it again later in this lesson.
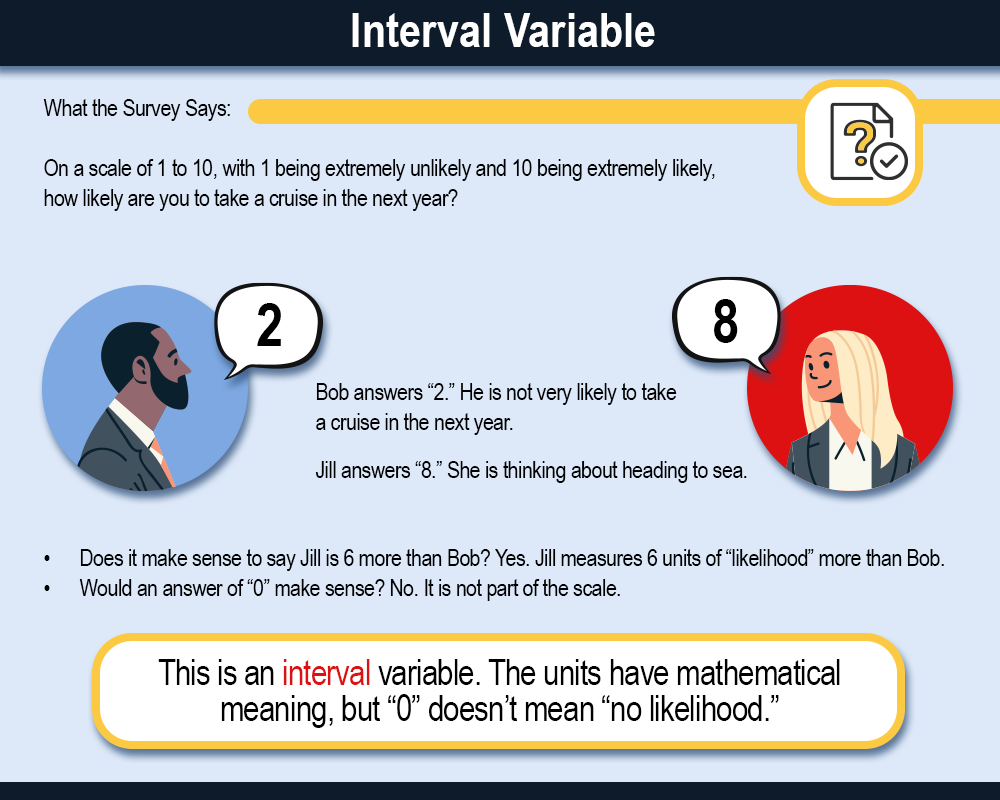
Now that we’ve discussed categorical variables, we can discuss continuous level variables. The first is interval level. Much like ordinal level variables, interval level variables have levels that are ranked. The main difference between ordinal and interval level data is that the levels within an interval variable are meaningful and traditionally are considered equal. This means that we assume that the difference between one level to the next is the same. Let’s explore at an example together.
The most common way that we collect interval level data is through Likert-type scales. Below is an example of a Likert-type scale.
On a scale from (1) Strongly disagree to 5 (Strongly agree) please rate your level of agreement with the following statements:
| Statement | Strongly disagree | Disagree | Neutral | Agree | Strongly agree |
|---|---|---|---|---|---|
| The Netflix series Stranger Things is interesting. | 1 | 2 | 3 | 4 | 5 |
| I enjoy watching the Netflix series Stranger Things. | 1 | 2 | 3 | 4 | 5 |
| I would recommend the Netflix series Stranger Things to a friend. | 1 | 2 | 3 | 4 | 5 |
If a participant received this question in a survey, they would read each statement and select the rating that best applied to their sentiment towards the statement. While there is some debate as to whether scales like this are ordinal or interval, many researchers treat them as interval level. The reason for this is that we assume there is equal difference between each level since we have assigned a numeric value to each level (e.g., 3 = Neutral). While this is an assumption, one benefit of this is that we will be able to do more interesting statistical analyses if we treat this data as interval instead of ordinal level. We will learn more about this in Lesson 3.
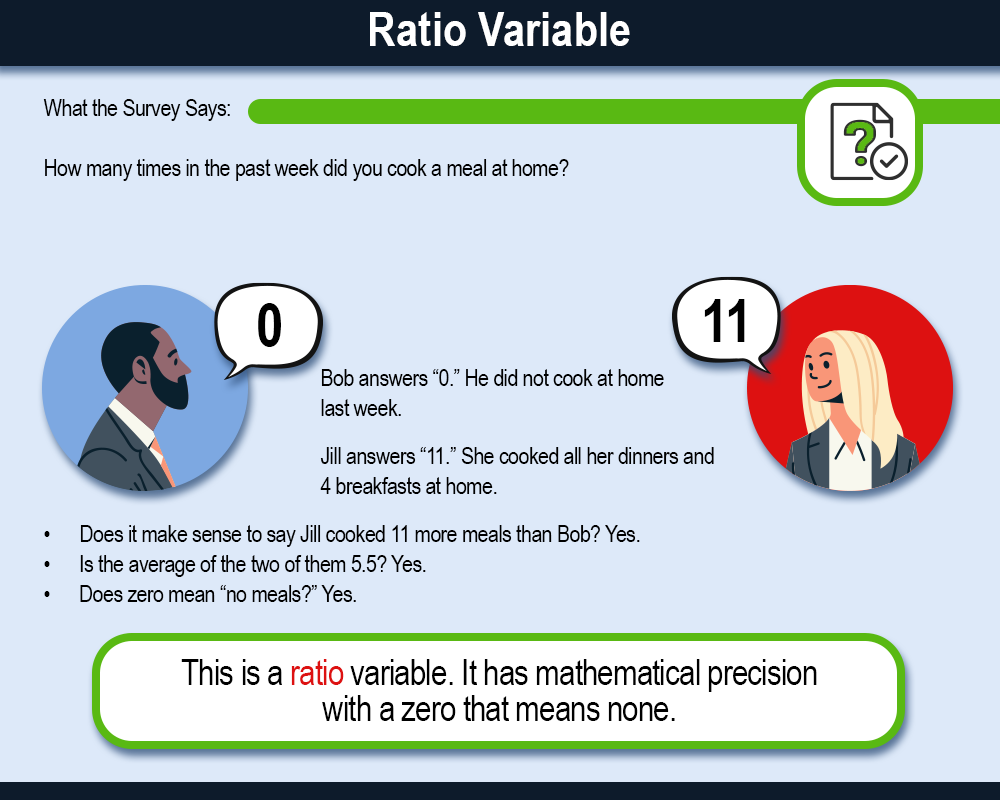
Finally, ratio level data are also continuous. Ratio level data have all the same attributes as interval level, but they also have an absolute zero. As such, we can produce meaningful ratios using this type of data. Let’s explore an example together.
Websites can track how long their users spend on each page of the website. Users may spend 30 seconds, 120 seconds, or even 360 seconds or more on a page. This type of data is ratio level. It is possible for a user to spend zero seconds on a page. In addition, if a user spends 60 seconds (or 1 minute) on a page they’ve spent half as much time as someone who spent 120 seconds (or 2 minutes). Therefore, we can produce meaningful ratios using this data.
Now that we’ve discussed how we might collect data as well as the types of variables for which we may collect data, let’s now discuss metrics.
How would you define a metric? Once you have a definition, check your answer.
A metric is a measurement of an underlying concept.
Some of our data that we collect may be utilized in their raw form as metrics. In other instances, variables may need to be combined to form meaningful metrics.
Analysts often need to measure various quantities as a means of tracking performance over time or comparing figures across units. You are likely used to measuring the physical dimensions of objects—for example, weights. These tangible variables present no challenges for measurement because you can observe the relevant quantities. But for intangible variables, such as self-esteem, optimism, or innovation, the challenges of measurement are much higher. For intangible variables such as these, the measurement process must ensure that what you are measuring is truly the underlying concept you want to quantify.
There are three requirements for a measurement to be considered a metric:
First, anything measurable has to be expressed in the form of a number. If something cannot be reduced to a number, it cannot be measured.
Second, anything measurable needs to be expressed in terms of units that all people can understand with or without explanation. For example, say that a person's weight is 158 pounds. Pounds are easily understood by all people because they are part of a standard system of weights and measures. Not all units are so easy to understand. When you use a ratings point as a unit of measurement for television audiences, it requires an explanation. Such units used in specialized fields also need to be understood by the practitioners within that field.
The third requirement for a metric is that it should be based on a well-tested and widely accepted methodology of measurement. The method of measurement is important because it affects the quality of all the numbers that are generated throughout the process. For example, when you go into a doctor's office, your blood pressure is measured via an instrument that needs to be used in a specific way. If the nurse does not follow the exact procedure, perhaps by not tightening the cuff around your arm correctly or by not waiting long enough to take a reading, then the results will not be accurate. In the case of media measurements, there are well-understood procedures that need to be followed for any measurement to be taken correctly.
In a business environment, metrics are used in a variety of ways. Ultimately, all metrics are used to measure performance over time. A salesperson may track the number of sales or the total sales revenue from month to month. Their manager, at the same time, may be tracking the commissions paid to them. Other metrics, such as operating margins and returns on investment, may also be tracked. These metrics allow the manager to take corrective action over time.
The most basic type of metric is a simple count of quantities, such as the number of visitors to a website, number of sales made in a particular time, number of pages viewed during a visit to a website, and so on.
Raw counts can be segmented along various dimensions. For example, the number of visitors can be segmented by gender or other demographics, which gives a better understanding of the types of people that a website attracts. If it can be determined that 75% of your visitors are men, your content can be modified accordingly.
Similarly, raw counts can be averaged to show trends over time. For example, average revenues or unique website visits can be calculated for different time periods. If average sales by salespersons can be calculated, it can tell the manager who is performing or underperforming related to the rest of the salesforce.
Managers may be interested in understanding how different variables relate to each other. For example, a common calculation is a profit margin: What percentage of sales revenue is actually profit for the company? The operating profit divided by the revenue for the company, expressed as a percentage, will indicate the efficiency of the company's operations.
A final type of metric is an index, calculated by totaling other types of metrics. Indices are often used when the concept to be measured is a complicated one or a composite of many different subconcepts. For example, marketing theory might indicate that more innovative customers are more likely to shop for a new product or brand. Innovativeness, here, is a complex idea comprised of a number of different psychological factors. To measure such a complex idea, a market researcher might use a number of questions and total the customer's responses to all of them. This will be an index of innovativeness. The Human Development Index (HDI) is often used to measure how developed a country is; it might have questions on everything ranging from infant mortality to adult education to average household incomes to the quality of the environment.
KPIs, key performance indicators, are metrics that organizations select to measure their progress. There can be organization-wide KPIs, project-level KPIs, or even individual KPIs.
Not only do KPIs allow organizations to track their performance, but they also help establish clear benchmarks. Taking the time to carefully construct KPIs can help ensure that expectations are transparent.
In order to come up with KPIs, you should think about what your goals are. You should also consider how you will measure progress towards that goal and during what period of time.
First, let’s start with some personal KPIs. Then, later in the lesson, we’ll examine KPIs of a leading media company. Let’s say that your primary goal for COMM 310 is stay engaged in the course. Here are examples of KPIs you, a student in COMM 310, might come up with.
What do we think of those KPIs? Luckily, we have a way to assess whether KPIs are SMART.
Using the “SMART” principles, you can assess whether different types of KPIs are SMART, and those principles will help you construct meaningful KPIs as well.
Although tools come and go, a popular tool for project management is Monday.com. This platform is easy to use and can help organizations track their KPIs. Here is a blogpost on Monday.com’s website that explains how you can use their tool to track KPIs.
Although we spend some time in COMM 310 learning tools, like Google Analytics and Microsoft Excel, we spend more time learning about concepts and developing skills that can be transferrable across tools. Therefore, if you gain a mastery of KPIs and Monday.com and in your next role you are expected to learn a new tool, don’t panic! You’ve already learned one tool and the foundational skills needed to learn more. More importantly, you understand why KPIs are important and how to identify meaningful KPIs for your organization.
As Lesson 2 concludes, you should have started learning about how and why organizations use data for decision making. In doing so, you explored different types of metrics and KPIS. After completing Lesson 2 and the quiz, you should be able to differentiate between the four key levels of measurement.
By the end of this lesson, make sure you have completed the readings and activities found in the Lesson 2 Course Schedule.
In Lesson 3, we will apply our knowledge of levels of measurement in order to begin to learn about descriptive statistics. In addition, we will engage in hands-on work with Microsoft Excel.