Main Content
Lesson 1: Decision Making Under Uncertainty

Measures of Position
Five-Number Summary
Exploratory data analysis often relies on what has come to be known as the "five-number summary." The five-number summary describes the data using values for the following:
- Minimum: The lowest data point.
- First quartile/25th percentile: 25% of the data falls below this point.
- Median: The midpoint. 50% of the data falls below this point.
- Third quartile/25th percentile: 75% of the data falls below this percentile.
- Maximum: The highest data point.
The five-number summary for each of the five production lines in our example is shown in the table below. Note that Line 5 has a high maximum compared to the other lines. We will investigate this in further detail later.
| Weight (Line 1) | Weight (Line 2) | Weight (Line 3) | Weight (Line 4) | Weight (Line 5) | |
| Minimum | 24.86 | 24.85 | 24.87 | 24.86 | 24.87 |
| 1st quartile | 24.86494136 | 24.84951363 | 24.86822835 | 24.86323203 | 24.8656515 |
| Median | 24.99956747 | 24.98879626 | 24.99455375 | 25.01186258 | 24.99256636 |
| 3rd quartile | 25.12359216 | 25.12290597 | 25.13664069 | 25.15478612 | 25.14793697 |
| Maximum | 25.74723625 | 25.72358749 | 25.65554908 | 25.89338591 | 27.6 |
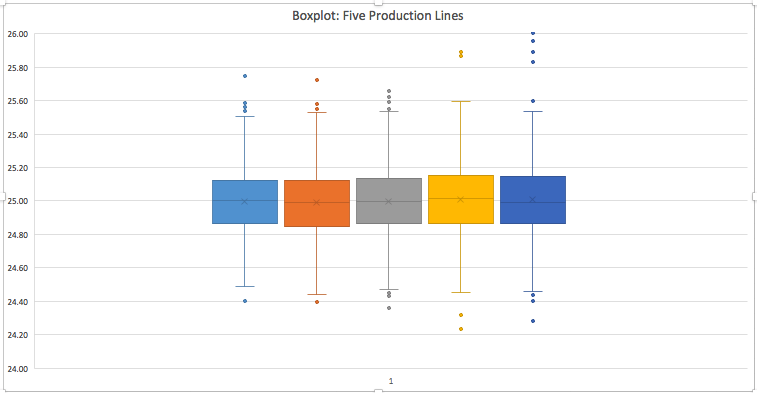
The five-number summary goes hand-in-hand with boxplots (also sometimes known as the box-and-whisker plots). The figure below is a boxplot of the five production lines. The first thing to consider in this graph is the box. The ends of the box locate the 1st quartile and 3rd quartile. The line in the middle of the box is the median. As you examine the box portion of the box, you should notice whether the boxes on either side of the median are of the same height or not. If not, it would imply skewed data (e.g., the 5th production line seems to have a bigger difference between the 3rd quartile and the median compared to the others. The data points in the extreme ends are the outliers. Lines called "whiskers" extend from the box out to the lowest and highest observations that are not outliers.
Example: Employee Salaries
The five-number summary for 280 employee salaries at Mobile Inc. is (in thousands) 45, 50, 75, 82, 160.
- How many employees make 75,000 or below?
- How many employees make 50,000–82,000?
- What could explain the gap between the third quartile and the maximum?
- Since 75,000 is the median, 50% of all data lie below. So 140 employees make 75,000 or below.
- 50,000 and 82,000 are the 1st and 3rd quartiles so 50% of the data lie between the two. So 140 employees make 50,000-82,000.
- The large gap between the last two could be accounted for by a few high paid executives who push the max a lot higher than most of the other employees.

Five-Number Summary Boxplot: SPSS Instructions Handout (Please refer to the SPSS intro handout first, from the page: Descriptive Statistics: Excel and SPSS Instructions.)