Main Content
Lesson 1: Decision Making Under Uncertainty

Comparing Standard Deviations
The standard deviation can offer insights into the data that you may not be able to get just through the measure of center. Take the following three data sets. Each set has the exact same mean. So, are the data the similar or the same? Not necessarily. The standard deviations for each set are different. The dot plot shows the great variation. While Set 2 is grouped around the mean, Set 3 has no data points close to the mean and a high standard deviation.
| Variable | Mean | StDev |
|---|---|---|
| Set 1 | 15.500 | 3.338 |
| Set 2 | 15.500 | 0.9258 |
| Set 3 | 15.500 | 4.567 |
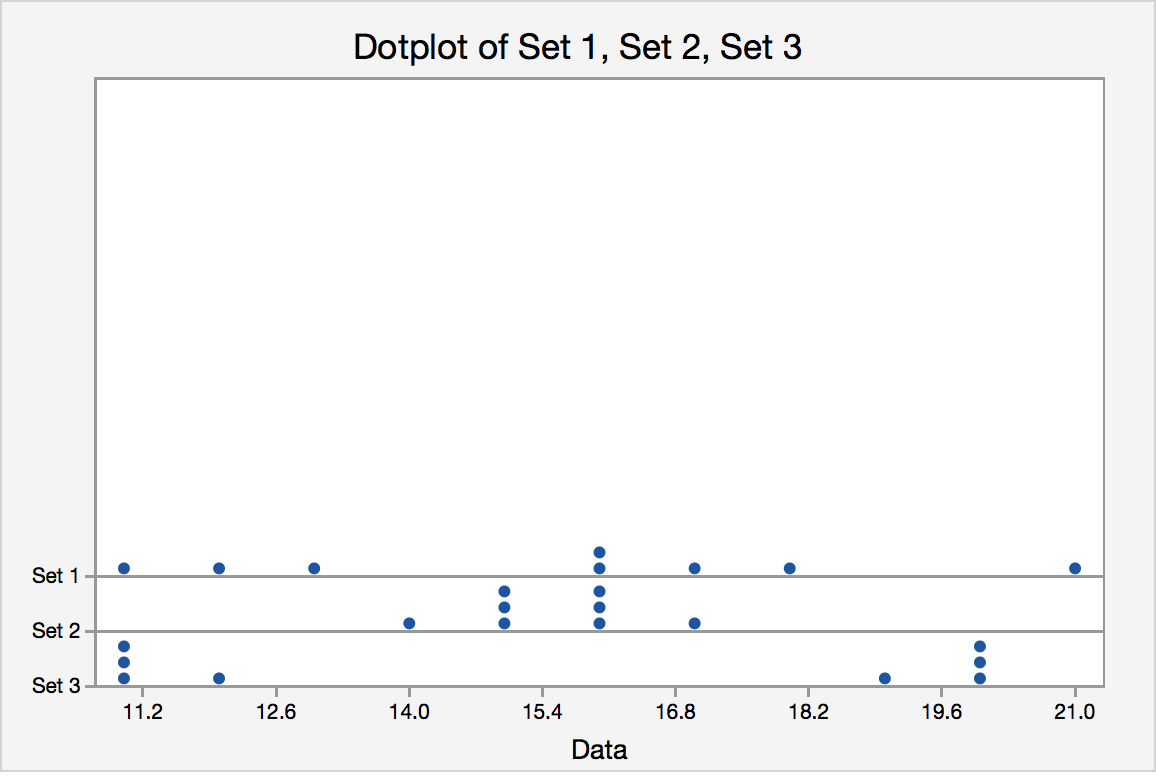
Figure 1.7. Standard Deviations in Different Datasets With the Same Mean
Coefficient of Variation
The coefficient of variation is a relative measure variation expressed as a percentage of mean. The coefficient of variation is given by the following formula:
- Coefficient of variation = standard deviation/mean
This is helpful if we are comparing different types of data (for example, does age or salary have a higher level of variability?) or datasets with varying means and standard deviation (e.g., do women's salaries show more variability than men's salaries?).