Main Content
Lesson 2: The Marketing Research Process and Research Design
- First Page
- Previous Page
- 4
- 5
- 6
- Next Page
- Last Page

2.6 Causal Research
The Purpose of Causal Research
Identifying causal relationships is very valuable for a company as it enables the company to influence sales by changing its actions. If a firm knows that increasing the advertising expenditures by 10% leads to a sales increase of 1–2%, it can use this information to determine whether it is worth increasing its advertising. For example, if the company's current advertising is $1,000 and current sales are $20,000, a 10% increase in advertising (which equals $100) will result in a 1–2% increase in sales (which is between $200–400), which is a profitable thing to do.
Examples of Causal Research Methods
Below are two examples of causal research methods. Click on the heading to familiarize yourself with each method. Note that the first "View All" tab allows you to see all four examples at once.
1. Regression Techniques
Causal relationships can be determined by advanced regression techniques, which require knowledge of somewhat complex statistical models, or by experimental methods.
2. Experiments
An experiment is typically the cleanest way to measure causal relationships. An experiment is a scientific investigation in which an investigator manipulates and controls one or more independent variables and observes the dependent variable for variation concomitant to the manipulation of the independent variable(s).
Did you know?
Think about the following question before you click to see the answer.
What is the difference between a dependent and independent variable?
Answer
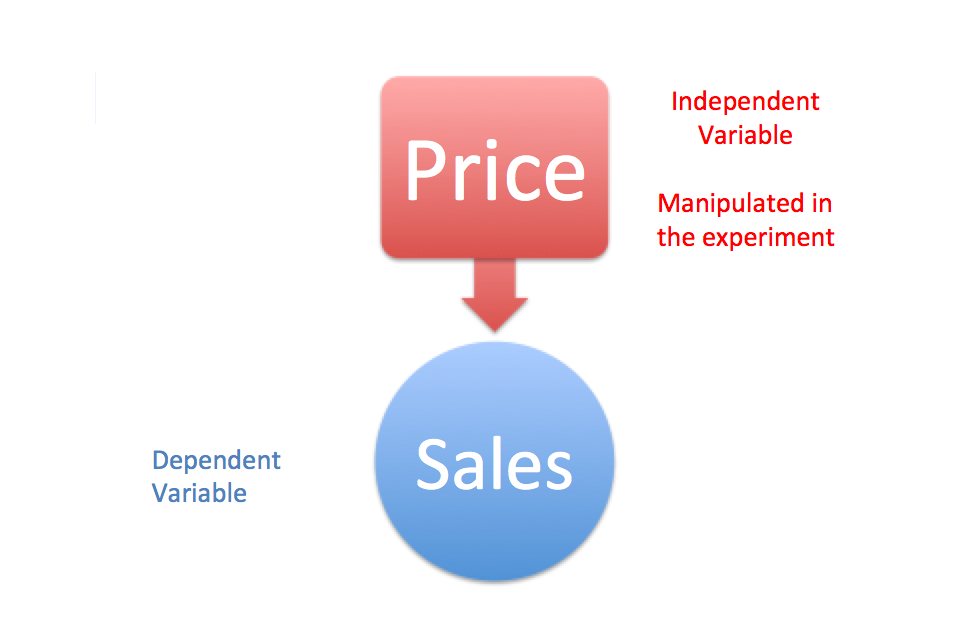
The independent variable in an experiment is the variable that the researcher changes in order to affect the dependent variable. The dependent variable is the variable that is being measured, or what is being affected.
For example, if you are interested in how a change in the price or package of a product affects sales, price and package are examples of independent variables and sales is the dependent variable.
Experiment: The Effect of Price on Sales
A classic experiment to discover the effect of price on sales is to run a two-week experiment in a store. In the first week you keep the price of a specific product at its normal level. In the second week, you drop the price of the same product by 10%. After the two weeks, you compare the sales for the product subject to price experimentation and determine the effect of a price change on sales.
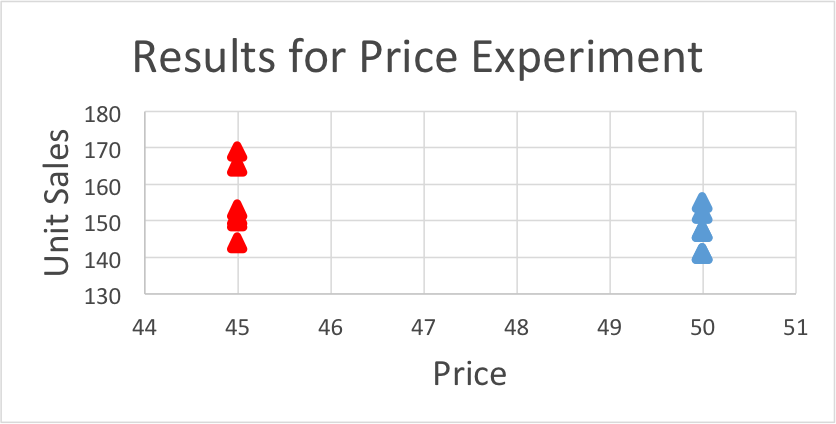
In an experiment, it is important that you manipulate only a limited number of variables and keep all other variables as similar as possible. For example, in the previous example, it would not work if the first week of the experiment is a holiday, while the second week is not. In that case, the researcher is not sure whether the change in sales is caused by the price or by the holiday. To prevent that the outcomes of an experiment may be caused by another factor than the one that is manipulated, the researcher needs to collect multiple observations for both conditions. For example, Figure 2.3 shows the effects of price on sales. In five weeks the normal price is used and in the other five weeks a discount is given. At first glance, it seems that the discounted price indeed leads to higher sales on average. Later in this course, you will learn how to formally assess whether the difference is indeed significant.
Today, many experiments can easily be conducted online. Online experiments are relatively cheap to perform and allow firms to learn a lot about causal effects relevant to their products. For example, Google uses a lot of simple online experiments, such as changing its logo, the layout of its webpage, or the order of search results. Google does these tests to determine how this affects the number of visitors on its website, how much time they spend on the website, whether they click on the advertisements; all this ultimately to increase profits.
- First Page
- Previous Page
- 4
- 5
- 6
- Next Page
- Last Page