
MKTG342:
Lesson 2: The Marketing Research Process and Research Design
2.1 Lesson Overview
Picture It!
However, SpaceX does have three initial ideas: (1) Offer two-week trips to research teams from companies and universities that allow the participants to conduct their own research for two weeks on Mars, (2) offer two-week guided tours to Mars for very rich individuals, and (3) provide monthly trips to Mars and back to Earth, establishing a colony on Mars such that people can stay as long as they want on Mars and can travel back when they want.
The company is uncertain about its technical developments in the next few years, but wants you to explore the profitability of these three options. It is also open to alternative ideas that can be commercialized. SpaceX expects you to provide a recommendation on which of the three ideas has the highest expected profitability.
At this point, you have been exposed to various examples of marketing research studies. You may have noticed that there is a wide variety of problems and decisions that may require marketing research.
Although the marketing research for SpaceX provides enormous challenges for the marketing researcher, other marketing research problems may be defined much more narrowly. For example, Jif Peanut Butter wants to reevaluate the sizes of the peanut butter jars it sells. Currently, the company offers 15.5 oz, 27.3 oz, 40 oz, and 4 lbs. Jif wants to know if there is demand for a smaller-sized jar.
Is there an overarching framework that applies to all types of marketing research, including the SpaceX and Jif examples? The answer is "Yes." This lesson will explore the steps that make up the marketing research process. This process will also provide the framework for the rest of this course, so it is very important to develop a good understanding of it. The remainder of the course will cover each step in more detail.
Lesson 2 will help you develop an in-depth understanding of the marketing research process and the research design, which will require some reading. The goal here is to get a solid foundation for the rest of the lessons. Lesson 2 covers the following topics:
- An overview of the marketing research process.
- When there is a need for marketing research.
- How to define the problem for the marketing research.
- How to establish research objectives.
- Three types of research designs: the exploratory, descriptive, and causal research design.
Note that for this Lesson you will have to read a book chapter by Burns and Bush that is available through the Course Reserves on the course navigation menu. So, you do not have to buy the book.
Please watch Dr. Eelco Kappe, the course author, talk briefly about examples (Video 2.1).
EELCO KAPPE: You just saw the examples of Jif and SpaceX, and examples are going to be really important in this marketing research course. Examples are very helpful and valuable to relate a theory to practice and to understand what we're learning in this course. However, in this lesson, we're going to focus a little bit more on the theory. And hopefully, we are all getting a solid foundation on what marketing research is.
So this lesson requires a little bit more reading than the rest of the course. There's a book chapter involved that you should read before continuing with the rest of this lesson, and it will help you to understand the marketing research process and the 11 different steps that make up the marketing research process. I know it's a lot of reading this time, but it will really help us for the rest of the course. Good luck.
Lesson Objectives
Before continuing with this lesson, think about the lesson objectives. After completing this lesson, you should be able to
- describe the steps in the marketing research process;
- define the marketing research problem;
- develop an understanding of the criteria that all research objectives should meet; and
- distinguish three different research designs.
Lesson Roadmap
By the end of this lesson, make sure you have completed the readings and activities found in the Lesson 2 Course Schedule.
2.2 Marketing Research Process
Before you continue with this lesson, you should study Chapter 3 of Burns and Bush (2013), which is available through the Course Reserves. It gives a comprehensive overview of the marketing research process and each of the different steps. It also provides a more in-depth discussion on the first three steps of the marketing research process (as shown in Figure 2.1).
Figure 2.1 illustrates the marketing research process. The figure is an adapted version of Figure 3.1 in Burns and Bush (2013) and will form the framework for the rest of the course. Note that the figure indicates which lesson will cover each step of the marketing research process. Subsequent lessons will include this figure as a reminder of where you are in the course.
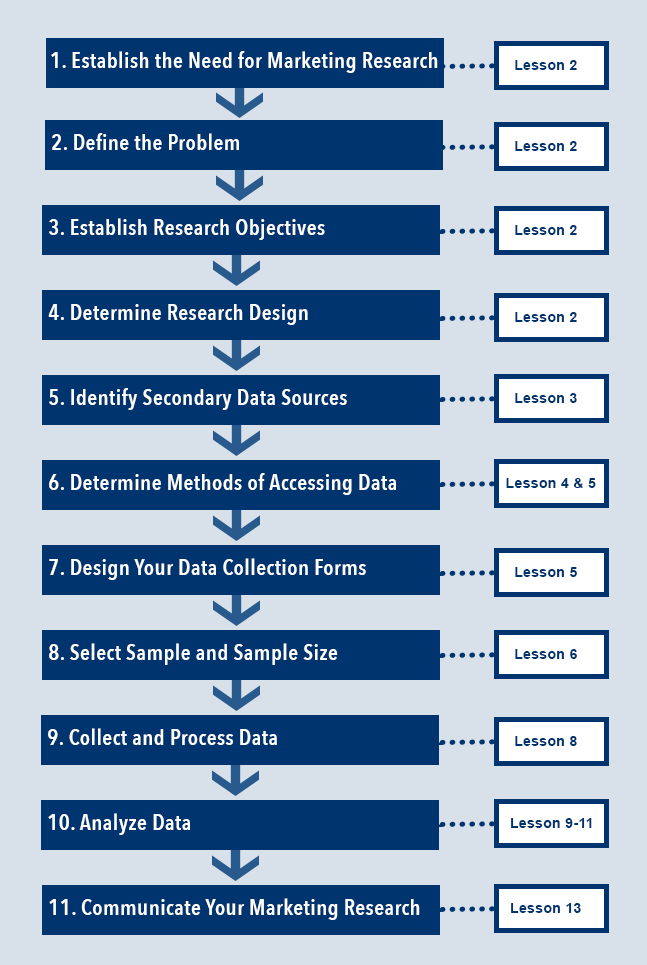
Adapted from Marketing Research (7th ed.), by A. C. Burns & R. F. Bush, 2013.
Self-Check Exercise
Following are several statements related to the different steps of the marketing research process. Please read each statement and decide whether each statement is true or false. Then, click "Show Answer" for verification. Make sure you have studied Chapter 3 of Burns and Bush (2013) before answering the questions.
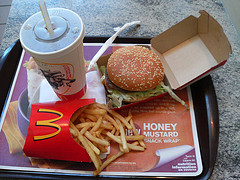
4. McDonald's has developed an energy drink. The company is investigating whether or not to introduce the new drink at its franchises. McDonald's has formulated the following research objectives:
"A sample of 10,000 regular McDonald's customers are provided with the choice between five menus. All menus consist of a Big Mac, fries, and a drink. The type of drink differs across the five menus and McDonald's provides the following five alternatives: soda, coffee, chocolate milk, water, and an energy drink. The price for each menu is the same. Customers are provided with samples of each of the five drinks so they can taste each one. They are asked to rank the five menus according to their preferences."
Reference
Burns, A. C., & Bush, R. F. (2013). Marketing research (7th ed.). Upper Saddle River, NJ: Prentice Hall.
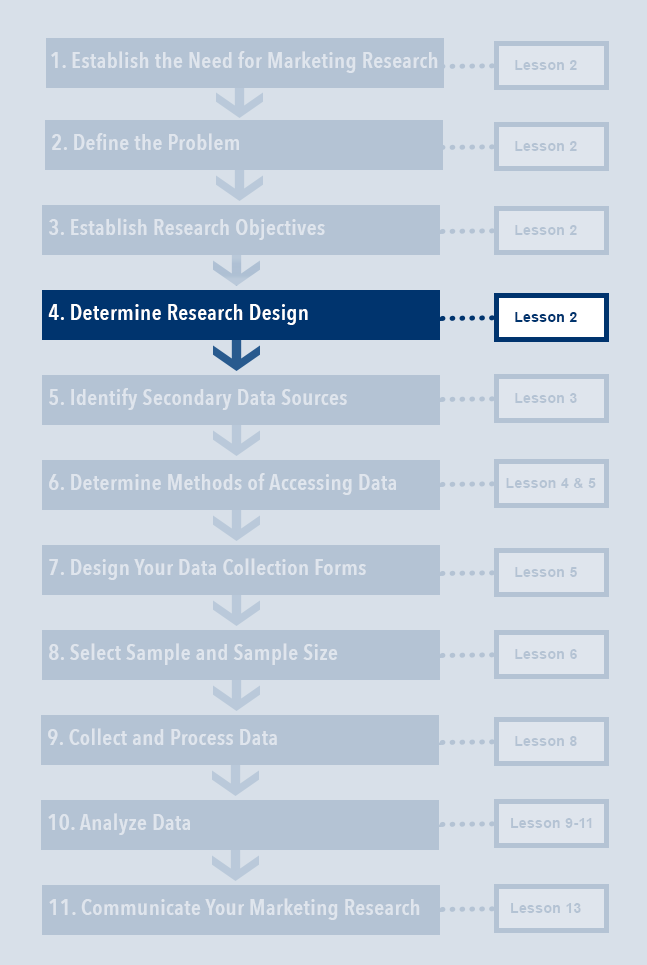
Figure 2.2. Determine Research Design in Marketing Research Process.
2.3 The Research Design
Marketing research studies may need one or more of a wide variety of available research methods. In the Lesson 1 Discussion Forum, you learned that there are a large number of possible methods to collect information. Surveys and focus groups are some of the more common and traditional methods. A marketing researcher can also use eye-tracking studies, food tasting studies, video analysis of the different paths of shoppers in a store, and mystery shoppers. Each method has advantages and disadvantages.
After familiarizing yourself with the problem and the research objectives, it is helpful to consider the most appropriate method(s) to use. The outcomes are formalized in the research design, which is a set of advanced decisions making up the master plan specifying the methods and procedures to collect and analyze the collected information. Note that the research design is Step 4 of the course framework (see Figure 2.2).
Table 2.1 shows the three types of research designs. Note that the choice among these research designs depends heavily on the research objectives. For each research design type, the table presents a research objective and a matching example.
| Exploratory Research Design | Descriptive Research Design | Causal Research Design |
|---|---|---|
For example, understand which factors influence the choice for a certain brand. |
For example, does your product satisfy your customers? |
For example, the relationship between price and sales. |
Marketing research can involve one or more of these research designs. Typically, exploratory research precedes descriptive research, which precedes causal research; however, the order can sometimes vary. For example, the outcomes of causal research may induce additional exploratory or descriptive research.
The next few pages will cover these three research designs in more detail.
2.4 Exploratory Research

For example, suppose you need a sturdy new umbrella. You could go observe people’s behavior on the street on a rainy and windy day. Are people using umbrellas? What are the different types of umbrellas? Do any umbrellas break because of the wind? Are people uncomfortable holding their umbrellas? Are some people more successful in protecting themselves from the rain? And so on.
Gerwin Hoogendoorn, an industrial design engineering student, did this when three of his umbrellas broke within one week. He decided to observe how people used umbrellas in windy conditions, and devoted his graduation project to desiging umbrellas. Check out the result on his company’s website.
The Purpose of Exploratory Research
Exploratory research has several uses:
- You can use it to simply collect background information about a problem.
- You can use it to define the various terms and concepts relevant to a project. For example, when the department interviews students to collect feedback on course offerings, it might learn about how students evaluate the course offerings (relevance, interest, fun, etc.).
- You can sharpen the research problem. Exploratory research can be used to gain a better understanding of the research problem and to formulate formal hypotheses for the research project.
Examples of Exploratory Research Methods
Later in this course you will examine the various exploratory research methods in more detail. For right now, you'll be introduced to some of the most common exploratory research methods to develop your understanding of this type of research. Click on the headings to get more information about each method. Note that the first "View All" tab allows you to see all four examples at once.
1. Focus Groups
A personal interview conducted among a small number of individuals simultaneously; the interview relies more on group discussion than on a series of directed questions to generate data. It is also called an "group in-depth interview." In a focus group, participants can build on each other’s arguments and express agreement or disagreement to a certain extent; this often leads to deeper insights than doing one-on-one interviews.
2. Case Analysis
A review of an earlier case that has similarities to the current research problem. Finding a case that has some or many similarities to the research problem at hand may provide valuable insights on the current problem. It can prevent a lot of work. However, you need to be careful in acknowledging the differences between cases. For example, a case from ten years ago may deal with consumers who did not heavily rely on the Internet to obtain product information, as compared to people today.
3. Experience Surveys
A series of interviews with people knowledgeable about the general subject being investigated. For example, when investigating potential uses of a new drug, it would be helpful to survey some doctors with a lot of experience with the specific drug and with related drugs.
4. Secondary Data Analysis
 The analysis of data not gathered for the immediate study at hand, but for some other purpose. These data are available on the Internet or from the company's internal databases. For example, you can use Google Alerts to keep yourself up-to-date on any new articles that mention the words "umbrella" and "wind."
2.5 Descriptive Research
What Is the Purpose of Descriptive Research?
You can use descriptive research to answer questions such as who, what, where, when, and how. For example, who are your customers? What products do they buy? Where do they buy the products? When do they visit the store? How do they pay for their product? This kind of descriptive information can often be easily extracted from the data that the client firm already collects.
Examples of Descriptive Research Methods
Descriptive research can involve two broad types of data. Click on each of the types below to familiarize yourself with them. Note that the first "View All" tab allows you to see all four examples at once.
1. Cross-Section Data
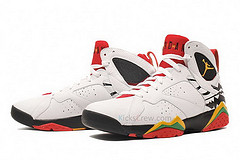
Cross-sectional data is a sample of elements selected from the population of interest that are measured at a single point in time. For example, this can be a survey about customers' opinions on a new design of the Air Jordan shoes.
2. Panel Data
Also called "longitudinal data," panel data is a sample of elements that is measured repeatedly through time. For example, when election time is nearing, several polls measure people’s preferences for the candidates every day/week/month.
Note that panel data can have some different characteristics. Panel data may be collected from the same respondents over time, which allows the researchers to assess differences at the respondent-level over time. However, panel data may also be collected from different samples over time (this is sometimes also referred to as repeated cross-sections), which only allows you to draw conclusions on changes at the aggregate level. Election polls are an example of the latter kind.
Descriptive analysis is relatively easy to perform once the data is collected. Examples of methods are computing the mean, mode, median, and standard deviation of the collected variables. You can also compute correlations or confidence intervals. You will learn more about these descriptive research methods in Lesson 9. The course will also cover how to use Excel and SPSS to compute descriptive statistics from your data.
2.6 Causal Research
The Purpose of Causal Research
Identifying causal relationships is very valuable for a company as it enables the company to influence sales by changing its actions. If a firm knows that increasing the advertising expenditures by 10% leads to a sales increase of 1–2%, it can use this information to determine whether it is worth increasing its advertising. For example, if the company's current advertising is $1,000 and current sales are $20,000, a 10% increase in advertising (which equals $100) will result in a 1–2% increase in sales (which is between $200–400), which is a profitable thing to do.
Examples of Causal Research Methods
Below are two examples of causal research methods. Click on the heading to familiarize yourself with each method. Note that the first "View All" tab allows you to see all four examples at once.
1. Regression Techniques
Causal relationships can be determined by advanced regression techniques, which require knowledge of somewhat complex statistical models, or by experimental methods.
2. Experiments
An experiment is typically the cleanest way to measure causal relationships. An experiment is a scientific investigation in which an investigator manipulates and controls one or more independent variables and observes the dependent variable for variation concomitant to the manipulation of the independent variable(s).
Did you know?
Think about the following question before you click to see the answer.
What is the difference between a dependent and independent variable?
Answer
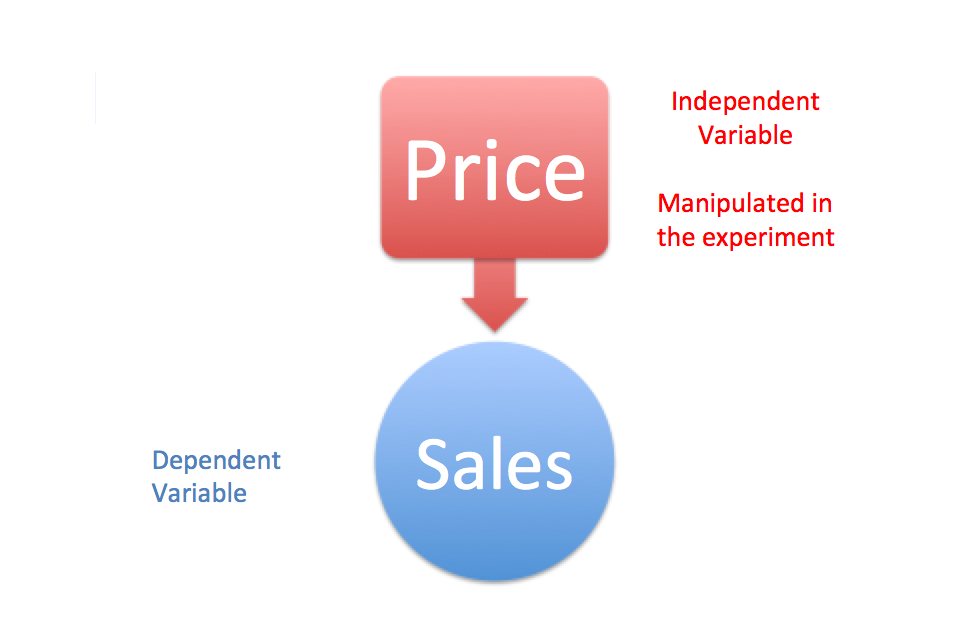
The independent variable in an experiment is the variable that the researcher changes in order to affect the dependent variable. The dependent variable is the variable that is being measured, or what is being affected.
For example, if you are interested in how a change in the price or package of a product affects sales, price and package are examples of independent variables and sales is the dependent variable.
Experiment: The Effect of Price on Sales
A classic experiment to discover the effect of price on sales is to run a two-week experiment in a store. In the first week you keep the price of a specific product at its normal level. In the second week, you drop the price of the same product by 10%. After the two weeks, you compare the sales for the product subject to price experimentation and determine the effect of a price change on sales.
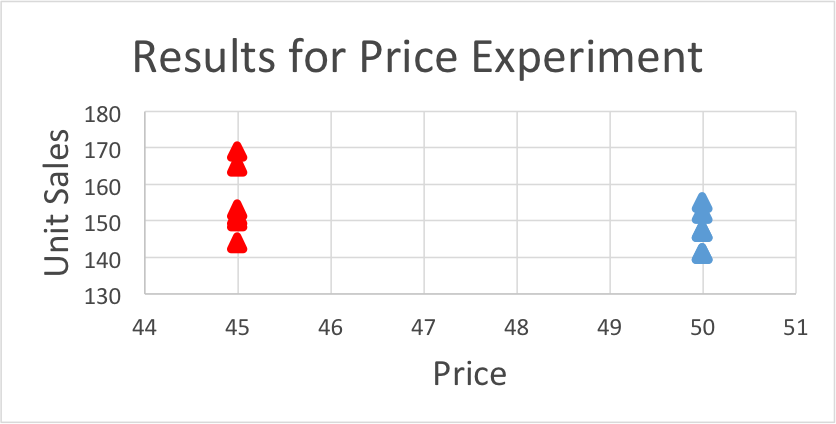
In an experiment, it is important that you manipulate only a limited number of variables and keep all other variables as similar as possible. For example, in the previous example, it would not work if the first week of the experiment is a holiday, while the second week is not. In that case, the researcher is not sure whether the change in sales is caused by the price or by the holiday. To prevent that the outcomes of an experiment may be caused by another factor than the one that is manipulated, the researcher needs to collect multiple observations for both conditions. For example, Figure 2.3 shows the effects of price on sales. In five weeks the normal price is used and in the other five weeks a discount is given. At first glance, it seems that the discounted price indeed leads to higher sales on average. Later in this course, you will learn how to formally assess whether the difference is indeed significant.
Today, many experiments can easily be conducted online. Online experiments are relatively cheap to perform and allow firms to learn a lot about causal effects relevant to their products. For example, Google uses a lot of simple online experiments, such as changing its logo, the layout of its webpage, or the order of search results. Google does these tests to determine how this affects the number of visitors on its website, how much time they spend on the website, whether they click on the advertisements; all this ultimately to increase profits.