
The Shape of a Distribution
The shape of a distribution of scores is usually described as either symmetric, meaning that it is similar on both sides of the center, or skewed, meaning that the values are more spread out on one side of the center than on the other. If it is skewed to the right, the higher values (toward the right on a number line) are more spread out than the lower values. If it is skewed to the left, the lower values (toward the left on a number line) are more spread out than the higher values. A symmetric dataset may be bell-shaped or another symmetric shape. Figures 1, 2 and 3 show examples of three different shapes.
Figure 1: A symmetric shape
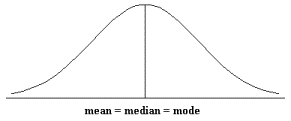
Figure 2: Data skewed to the right (also called positively skewed)
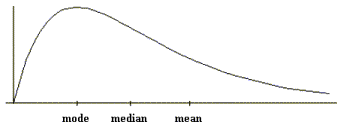
Figure 3: Data skewed to the left (also called negatively skewed)
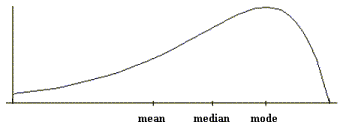
As these three figures indicate, the mean can be quite strongly affected by the shape of the distribution and the presence of extreme scores. The median and mode are less strongly affected by these factors.
Lesson 2 Assignments:
1. Complete Homework Chapter 2
2. Complete Evaluation exercises Chapter 2 (possible direct link to homework assignments if we are able to do this with Web Assign)