Main Content
Lesson 2: Distributions

Probability
- Probability
- Probability is the numeric value representing the chance/likelihood/possibility that a particular event will occur.
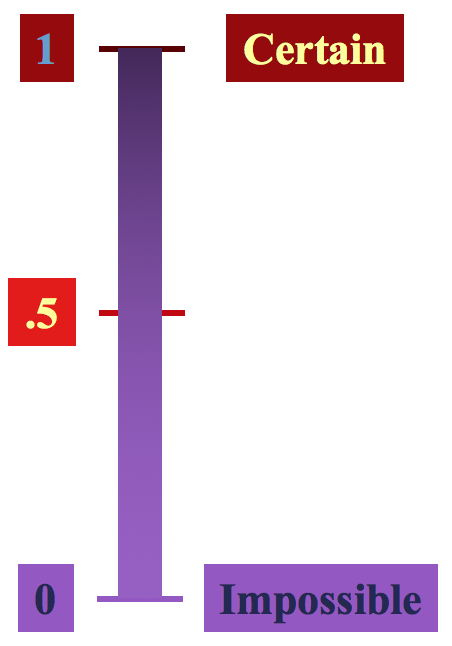
Some important properties of probability are:
- The value of probability lies between 0 and 1.
- Probabilities are mostly expressed as percentages.
- The sum of the probabilities of all mutually exclusive and collective exhaustive events is 1.
Probability Notation
It is very important that we learn to express probability events using a scientific notation, as we will be using these concepts extensively in all future lessons.
- P(X) denotes the probability of an event X happening.
- For example, what is the probability of getting a five when rolling a die?
- Event: getting a face with five dots
- Possible outcomes: 1, 2, 3, 4, 5, 6
denotes the probability of the event that five spots turn up when you roll a die, and X represents a variable that captures the value shown on the face when we roll a die.
It is important that we learn to use this probability notation, as we will see that it will be very useful in the course later.
We know that if we have a fair die, there is an equal chance that any one of the faces turns up. Because there are six faces on a die, we can express the probabilities as follows:
In other words, there is a 1/6th (i.e., 16.67%) chance that the face with one spot (or two or three or four or five or six) will turn up when we roll a die.
Also, remember that the cumulative probabilities of all possible outcomes should equal one. Mathematically, we can write:
A Word About Interpreting Probabilities
Suppose you toss a coin 10 times and you get seven heads and three tails. Weren’t you supposed to get five heads and five tails? What happened to the laws of probability?
We often make these kinds of mistakes when interpreting probability. Remember the assumption of probability is that you are performing the same activity many times under the same conditions. If you toss the coin 100 times instead of 10 times, you will see that you have a roughly 50-50 split between heads and tails, and the ratio of heads to tails would become increasingly equal as you toss the coin 1000, 10000, 100,000, and so on, times.
While it is easy to understand this concept with a coin toss, we still make mistakes in our everyday life. For example, what does the statement that Candidate A has a 70% chance of winning the U.S. presidential election actually mean? It means that if the elections are repeated multiple times, keeping all other factors (e.g., economy, climate, labor market, etc.) exactly the same, Candidate A will win the race about 70% of the time. This means Candidate B (U.S. presidential elections are primarily between two candidates) will win 30% of the time. Of course, elections happen only once. So, if candidate B wins, we need to understand that this was less likely to happen, not unlikely to happen.
If you remember the 2016 U.S. presidential elections, this is exactly what happened. Most polls and statistical models gave Mr. Trump a lesser likelihood to win. After the results came out, quite a few prominent news anchors said statistical models were wrong, showing a poor understanding of probability.