Main Content
Lesson 2: Distributions

Probability Distribution
- Probability distribution
- Probability distribution is a table or a graph showing the different possible outcomes and their corresponding likelihood.
| X | |
|---|---|
| Head | 0.5 |
| Tail | 0.5 |
| X | |
|---|---|
| 1 | 0.167 |
| 2 | 0.167 |
| 3 | 0.167 |
| 4 | 0.167 |
| 5 | 0.167 |
| 6 | 0.167 |
| X | |
|---|---|
| Hillary Clinton wins | 0.714 |
| Donald Trump wins | 0.286 |
1 Information obtained from FiveThirtyEight: 2016 Election Forecast.
Interpreting Probability Distributions
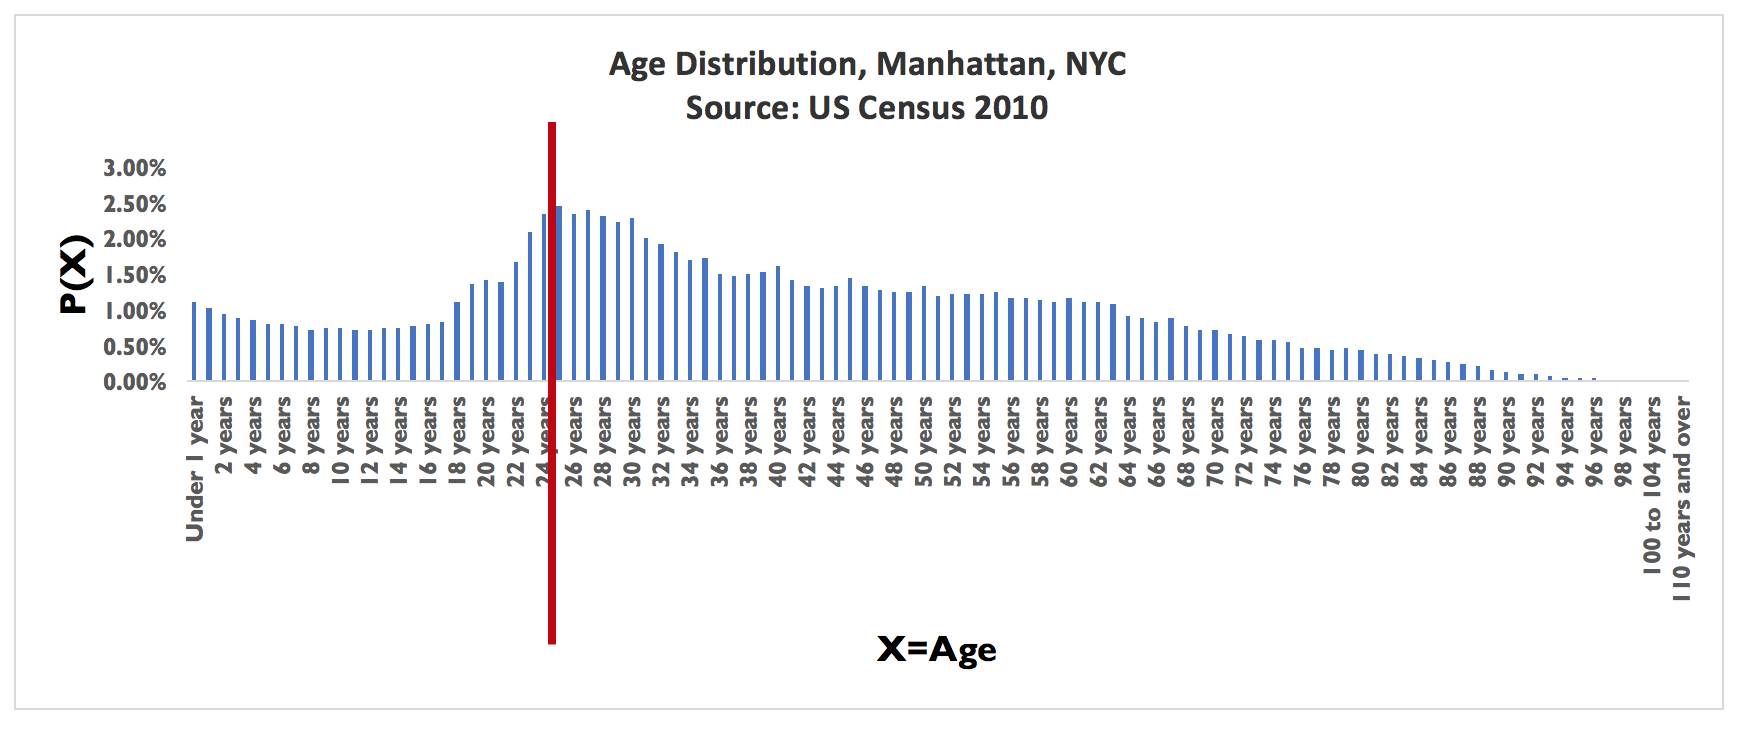
The height of each bar represents the probability of observing that particular value of the variable. For example, the height of the bar for age = 24 years represents the probability that a randomly selected Manhattan resident is 24 years old.
If we add up all the heights of the bars in Figure 2.2, it would equal 1 because we know that the cumulative probabilities equal 1.
The sum of the heights of all the bars to the left of the red line (drawn at X = 24) represent the probability that a randomly selected Manhattan resident is 24 years old or less. The sum of all the bars to the right of the red line (drawn at X = 24) represent the probability that a randomly selected Manhattan resident is more than 24 years old.