Main Content
Lesson 2: Distributions

Interpreting the Normal Distribution
Changes in the Mean and Standard Deviation
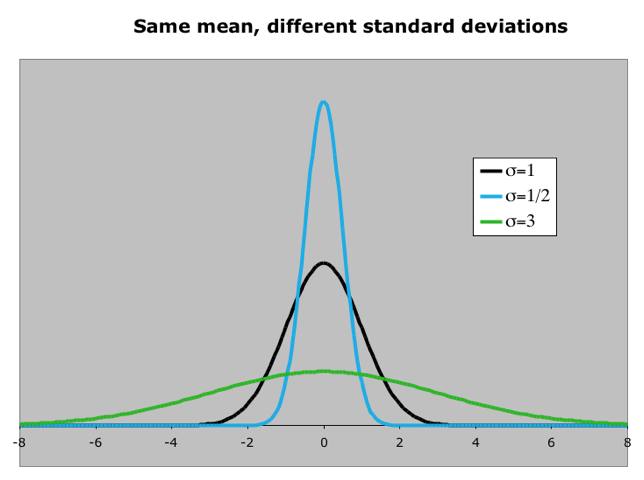
As mentioned earlier, the normal distribution is described by two parameters, its mean and its standard deviation Increasing the mean shifts the curve to the right (see Figure 2.6) while increasing the standard deviation “flattens” the curve (see Figure 2.7). The first figure shows what happens when the mean changes. The second figure shows what happens when the standard deviation changes.

Area Under the Curve
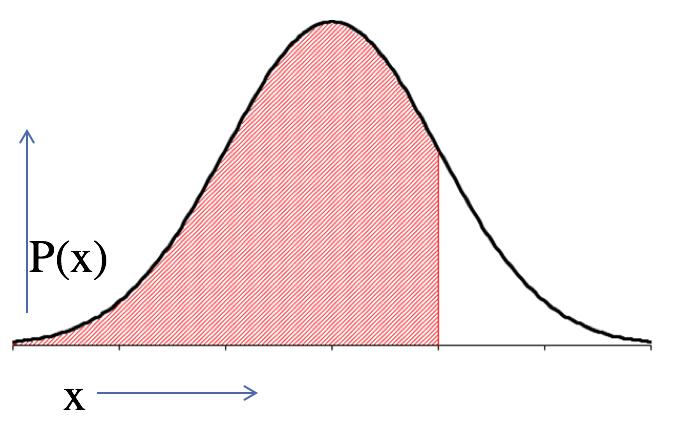
Figure 2.8. Interpreting the Area Under a Normal Distribution
A normal distribution is essentially a histogram, where the horizontal axis represents the value of the variable and the vertical axis represents the probability (i.e., the relative percentage) of finding that value (imagine that you keep reducing the bin/class width of a histogram such that the individual bars become closely packed thin slices).
Now remember from our discussion on probability that the sum of all the individual probabilities adds up to 1. So the total area under the normal distribution curve is 1. It represents the probability that the variable falls within the range to . The shaded area in the adjoining figure represents the probability that the variable is less than or equal to a particular value. The white area represents the probability that the variable is greater than or equal to a particular value.
A normal random variable can have an infinite number of values, so the probability of each individual value is virtually 0. Thus, we can determine the probability of a range of values only.
For example, with a discrete random variable like tossing a die, it is meaningful to talk about the chance that we will observe 5 when rolling the die. However, in a continuous setting (e.g., with time as a random variable), the probability that the random variable of interest, say task length, will take exactly 5 minutes is infinitesimally small (we can slice up time in nanoseconds or less), hence . It is only meaningful to talk about .