Main Content
Lesson 2: Distributions

Using the Normal Curve in Inventory Management
Let's return to the first case and see how you can use normal probabilities to help the gas station owner make his decisions.
Inventory Management Issue 1: Find Probability (P)
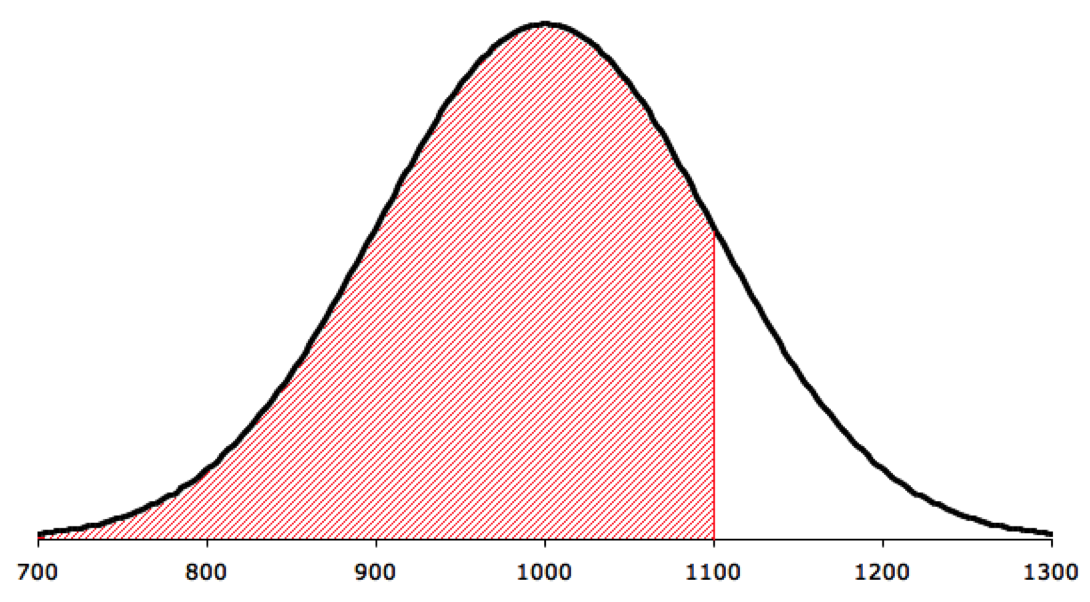
The demand is normally distributed with mean and standard deviation . You want to find the probability
Graphically, you want to calculate the area of the shaded region. You can use Excel formulas to find the value of
Use the NORM.DIST function to compute cumulative normal probability The function takes the following form:
You know that so the Excel formula should be entered as follows:
You will get 0.841345 as the answer.
- Therefore, there is an 84% chance that the gas station will not run out of gas today.
- Alternatively, 84% of the days, the demand is 1,100 gallons or less.
*Remember, always set Cumulative = TRUE with normal distribution. Because the normal curve represents a continuous variable, the probability that demand will be exactly 1,100 gallons is very small. We can only predict the probability of demand being less than or equal to 1,100 gallons.
Inventory Management Issue 2: Using Probability to Find Variable Values
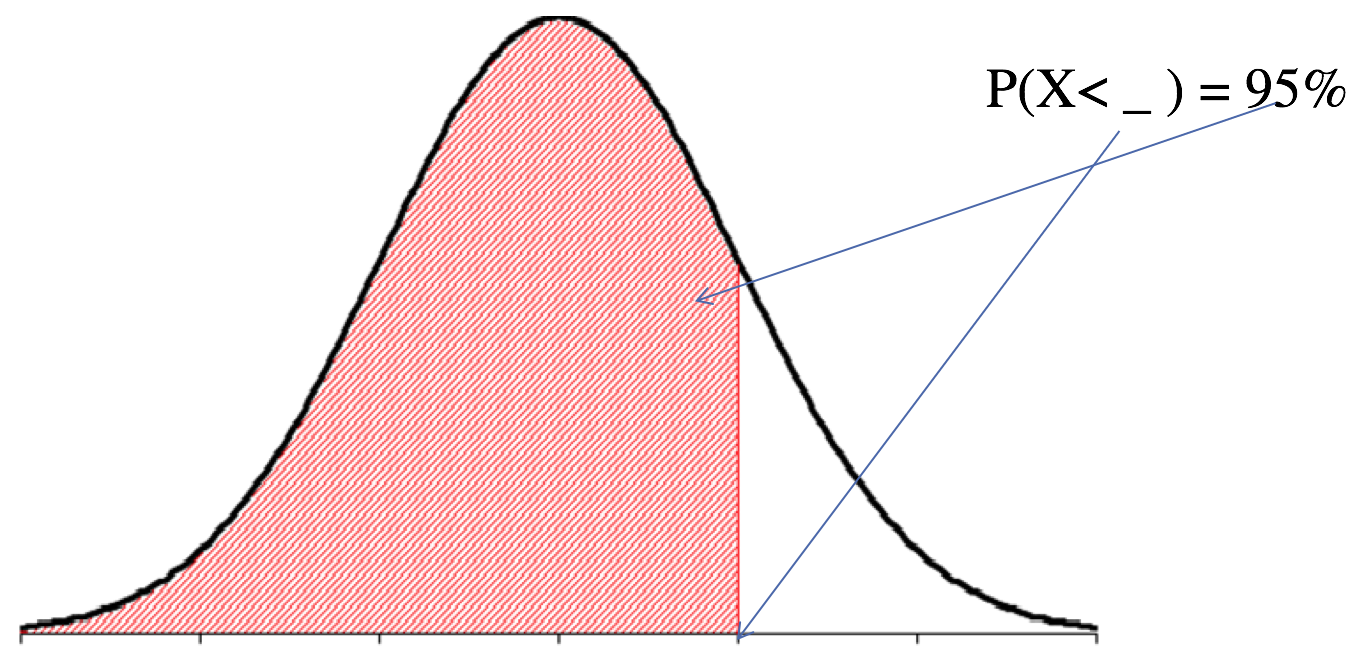
The owner wants to know the stock level that he has to maintain if he wants to meet demand at least 95% of the time. Graphically, you want the area of the shaded portion to be 0.95, so we would like to know at what value of x (inventory level) the area on its left-hand side will be 0.95. In operations, this is known as the safety stock.
In this case, you will the NORM.INV function on Excel. The function takes the following form:
, so the Excel formula should be entered as follows
; you will get 1164.48 as the answer.
- Therefore, if the gas station keeps 1,165 gallons of gas, 95% of the time it will not run out of stock.
- Alternatively, 95% of the time, the demand is 1,165 gallons or less.