Main Content
Lesson 2: Distributions

Empirical Rule: Normally Distributed Variables
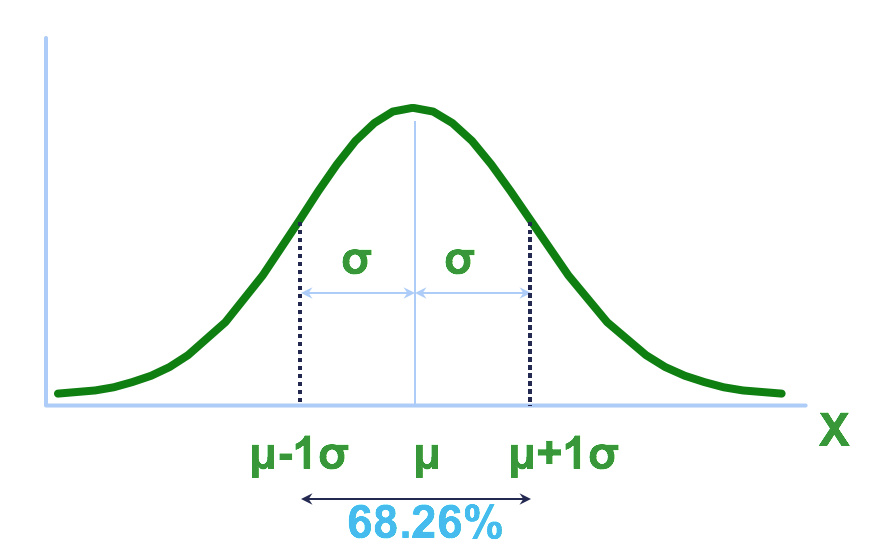
For any normal distribution,
encloses about 68.26% of the data.
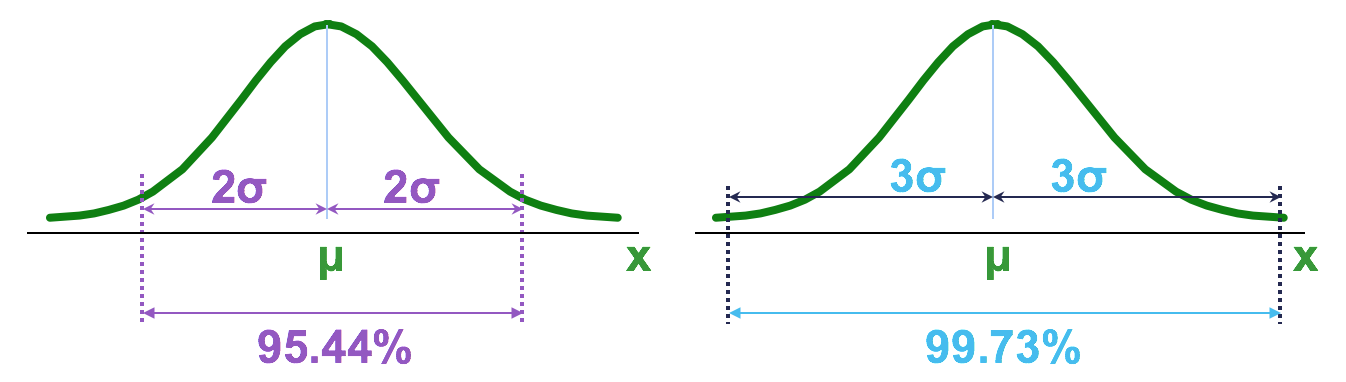
covers about 95.44% of the data.
covers about 99.73% of the data.
covers about 99.99% of the data.
Empirical Rule: Applied to the Inventory Management Example
Remember the example where daily demand for gasoline at a pump is distributed normally with mean 1,000 gallons and standard deviation 100 gallons.
- 68.26% of the times demand is between (1,000 - 100) = 900 and (1,000 + 100) = 1,100 gallons
- 95.44% of the times demand is between (1,000 - 2*100) = 800 and (1,000 + 2*100) = 1,200 gallons
- 99.73% of the times demand is between (1,000 - 3*100) = 700 and (1,000 + 3*100) = 1,300 gallons