Main Content
Lesson 2: Distributions

Z-scores
Often, we want to compare values of a variable with respect to others. We might want to know how our IQ compares with others, where we stand on the income scale compared to the rest of the U.S. population, how an employee performs in comparison to her peers, and so on. The z-distribution or the standard normal distribution is a widely used method to judge how extreme a value is compared to the average. Now that we know the properties of normal distribution, especially the empirical rule, we will see how to use these properties to compare values on a relative scale.
-
Z-score
-
The z-score is a relative comparison of an observation and is calculated using the following formula:
where x = variable value, = population mean, and σ = population standard deviation.
The z-score is a way of measuring how unusual an observation is and is the number of standard deviations above or below the mean. A z-score of zero indicates the value is the same as the mean, whereas a positive or negative value will indicate that the value is above or below the mean respectively. Let's illustrate with the following example.
Z-scores: Comparing Performance
The table below provides your performance and the class performance in two exams. On which exam did you do better?
| Class average | Class standard deviation | Your score | |
|---|---|---|---|
| Exam 1 | 50 | 10 | 60 |
| Exam 2 | 65 | 15 | 70 |
In this example, we can calculate your score in terms of z-scores.
| Exam 1 | Exam 2 | |
|---|---|---|
| Your score | ||
| Average | ||
| Standard deviation | ||
| Your score in standard units |
You scored 1 standard deviation above average in the first exam and 0.33 standard deviation above average in the second exam. So, your performance was better in the first exam although the absolute score is higher in the second one.
Interesting Fact: Einstein's IQ
IQ Scores: Mean (µ: 100; Standard Deviation
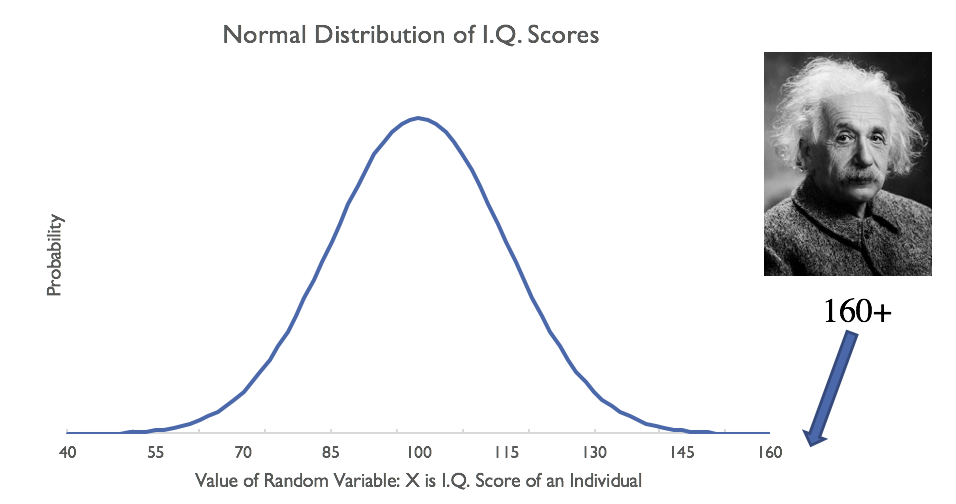
Z-score of Einstein's IQ
How extreme is z = 4 (i.e., a score 4 standard deviations above the mean)? We will see shortly.