
Example of Linear Regression
The historical data on the cost (in hundreds of $) for a project activity is given below. Develop a trend equation using Linear Regression Analysis and forecast the cost of this activity for period 10 and 15.
t |
y |
1 |
58 |
2 |
57 |
3 |
61 |
4 |
64 |
5 |
67 |
6 |
71 |
7 |
71 |
8 |
72 |
9 |
71 |
The calculations for determining the slope and intercept of the regression line are shown below
t |
y |
t*y |
t2 |
y2 |
1 |
58 |
58 |
1 |
3364 |
2 |
57 |
114 |
4 |
3249 |
3 |
61 |
183 |
9 |
3721 |
4 |
64 |
256 |
16 |
4096 |
5 |
67 |
335 |
25 |
4489 |
6 |
71 |
426 |
36 |
5041 |
7 |
71 |
497 |
49 |
5041 |
8 |
72 |
576 |
64 |
5184 |
9 |
71 |
639 |
81 |
5041 |
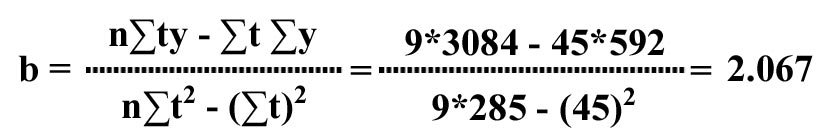
The slope b of the line is given by:
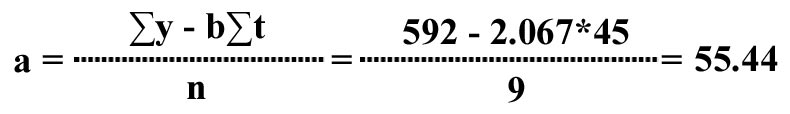
The intercept a of the line is given by:
Hence the linear trend equation is given by:
yt = a + bt = 55.44 + 2.067t, and
The forecast for period 10 is given by
y10 = 55.44 + 2.067*10 = 55.44 + 20.67 = 76.11
For t = 15, y15 = 55.44 + 2.0667 *15 = 86.445
In the discussion and example above on linear regression analysis, the independent variable was t--the time period. However, the linear regression technique can also be used determine association or causation between two variables. In such cases, we use the notation x for the independent variable and y for the dependent variable. The linear regression equation in such cases would be of the form
yc= a + bxi, where
The slope b of the regression line is given by:
.
The intercept a of the regression line is given by:
.