
2.4 Forecasting the Project End Conditions
One particular issue that is always of concern to the project manager is the point at which the project will end. This can be of supreme importance if the project has to be completed by some opening date that has been fixed well in advance, like the Olympic Games, for example. One possible approach is the use of a Slip Diagram, which is a simple graphical technique based on linear trend estimation. This method was covered in Module 1/MANGT 510 and hence the coverage here will be brief. The slip diagram as a method of predicting the project end date is based on two sets of time series; a regular series of estimates of when the project will end and a record of when those estimates are made. Plotting one data series against the other will reveal whatever pattern that exists and if the relationship is linear, it can be extrapolated to produce a forecast of the completion date. Slip Diagrams can also be used to forecast significant milestones in a project. A sample slip diagram is presented below in Figure 2.6.
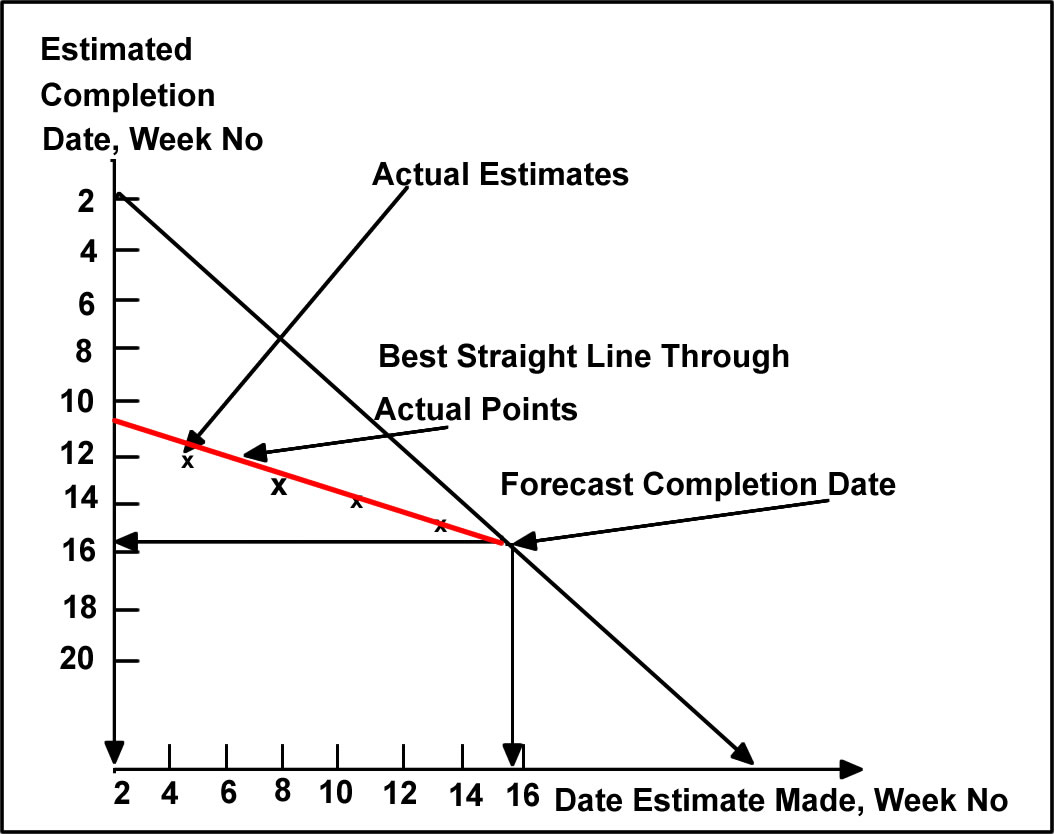
Figure 2.6 Construction of a "Slip Diagram"