
Evaluating the "Fit" of the Regression Line
The nest step in regression analysis after obtaining the regression line is to evaluate how well the model describes the relationship between variables, or how good is the line of "best fit". Three measures can be used to evaluate how well the computed regression line fits the data. These are: The Coefficient of Determination (R2 ), The Correlation Coefficient (r), and The Standard Error of the Estimate (syx)
The Coefficient of Determination (R2)
Three Measures of variation can be computed in linear regression analysis. These are:
- Total sum of squares (SST)
This measures the variation of the actual Y-values around the mean Y.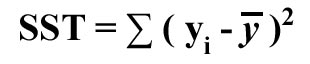
- Explained variation (SSR) or the regression sum of squares
This measures the variation due to the relationship between X and Y, i.e., the difference between the mean Y and the predicted value Y using regression.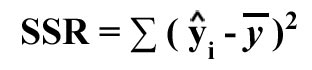
- Unexplained variation (SSE) or error sum of squares
This measures variation not explained by regression, i.e., variation due to other factors or variables not included in the regression model.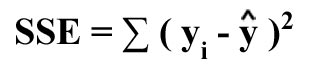
- Coefficient of Determination (R2)
This is the proportion of variation explained by regression (i.e., by the relationship between X and Y). The formula to compute R2 is: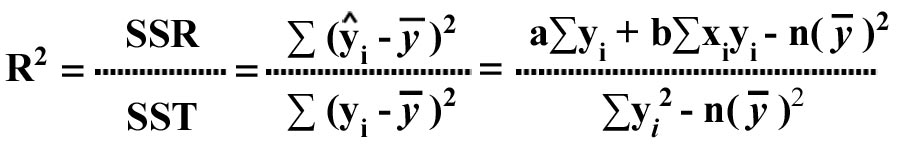
R2 takes on a value between 0 and 1. The higher the value of R2 the better is the line of fit.